

In the business environment and volatile data plays an important role than ever in the strategic decisions for the business. However, the raw data has no value if it is not processed, analyzed and converted into information that can act. This is where Business Intelligence (BI) has become a indispensable tool for modern business.
So BI what is, why businesses need it, where are the BI tools powerful today? This article Lac Viet will help you understand more about the role, application and selecting BI tools suitable to enhance financial performance, business management more effective.
The same theme:
- Analysis of financial indicators, business comprehensive
- Financial analysis business intuitive
1. Business Intelligence (BI) is what?
1.1 definition
Business Intelligence (BI) is a system to collect, analyze and visualize data to help businesses transform raw data into valuable information, from which support the management decisions more accurate. Speaking in an understandable way, BI is “assistant data analysis” help managers not only see the numbers, but also understand the story behind that number.
BI doesn't just stop at analysis of financial statements, business traditional but also the integration of AI, Machine Learning, Data Analytics to help business capture business trends, detect financial risks, given the optimal strategy based on real data.
For example, Instead of only seeing revenue in year 4 is 5 billion, BI will tell you:
- Revenue comes from products?
- Any area reach beyond just goal?
- Cost-how are abnormally increased?
- Margins are falling?
1.2 Manner of operation of BI
A system of Business Intelligence consists of four main stages:
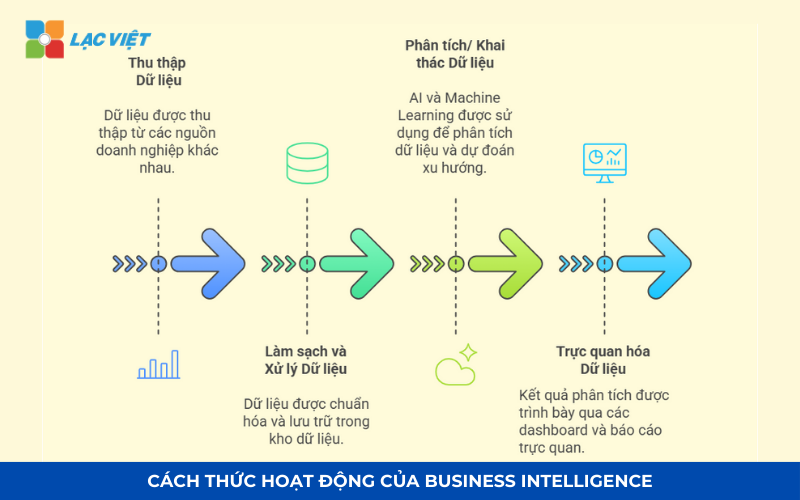
Phase 1: collect data
Data are aggregated from many different sources: accounting software, ERP, CRM, transaction data, financial statements, customer data. BI can connect with the system of corporate governance as AccNet, SAP, Oracle, Microsoft Dynamics.
Stage 2: cleaning and processing data
BI system standardization, data cleansing, ensure accuracy prior to analysis. Data Warehouse (data Warehouse, BI) store the entire financial information, help businesses easy access.
Stage 3: analysis, data mining (Data Mining & AI Analytics)
AI and Machine Learning support, in-depth analysis, predict financial trends. Detection system financial risks, unusual in the report, the growth trend in revenue.
Stage 4: data visualizations
The analysis results is shown through the dashboard, chart, finance, report automatically. Help the CEO, CFO, chief accountant easily grasp the financial situation in real time.
2. Why business need Business Intelligence?
Business Intelligence is becoming integral element of strategic business management. Follow Gartner:
- More than 80% of large enterprises have deployed BI to optimize financial performance, and risk management.
- 60% of businesses considered BI is the core tool in financial management, planning, strategy.
- BI helps business performance improvement, financial analysis, up to 50%, shorten the synthesis time reports from several days down to just a few minutes.
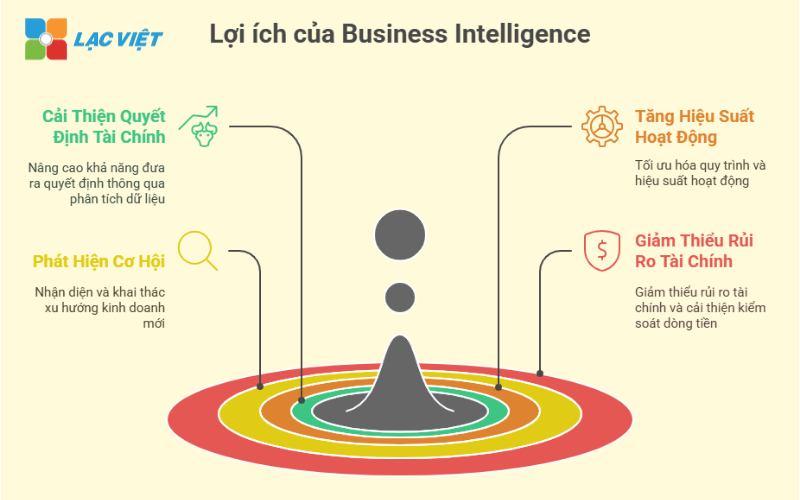
2.1 Improve the quality of financial decisions business
Financial management business traditional common problem of latency data, which affects the speed of decision making. BI helps business:
- Provides data in real time, help the financial manager to grasp the situation immediately.
- Analyze financial trends and predict the scenario, business help, business strategy a reasonable investment.
- Optimize cash flow, minimize shortage or excess capital.
2.2 Increase the performance and optimize the decision-making process
According to McKinsey, the business has BI can increase performance by up to 40% compared to traditional methods thanks to:
- Automate the process of synthesis, financial statements, time-saving work for the accounting department.
- Integrate data from multiple departments, to help the department make decisions based on the same system, accurate data.
- Support budgeting, financial forecasting quickly, help businesses adjust strategies in real time.
For example, A corporation can use BI to automatically analyze the cost of raw materials, from which minimize waste, optimize the product price.
2.3 detection of trends, opportunities, business
Business Intelligence not only helps business, financial analysis, but also support market assessment, consumer trends:
- Analyze customer behavior to help businesses optimize marketing campaigns.
- Predict product demand, decision support, order entry, production.
- Track KPI financial help business adjust business strategy flexible.
According to Harvard Business Review, businesses use BI to optimal trading strategy can increase the conversion rate customers, up 25% compared with the opponent does not apply BI.
2.4 Reduce risk, financial control, cash flow, effective
One of the biggest benefits of BI is to manage financial risks:
- Automatically detect irregularities in, financial statements, warning the expenditures exceed the budget.
- Forecast cash flow, to help businesses plan to raise capital in a timely manner.
- Support control, receivables, payables, ensuring steady cash flow.
According to research by Deloitte, the business app can reduce 35% of errors in financial statements, thanks to the automation of data analysis and cross-checking data from multiple sources.
3. The important component of the BI system
System Business Intelligence (BI) includes many components that help businesses collect, aggregate, analyze, visualize financial data and business. Four important component following to help businesses optimize financial statements, trend forecasting, performance improvement, business.
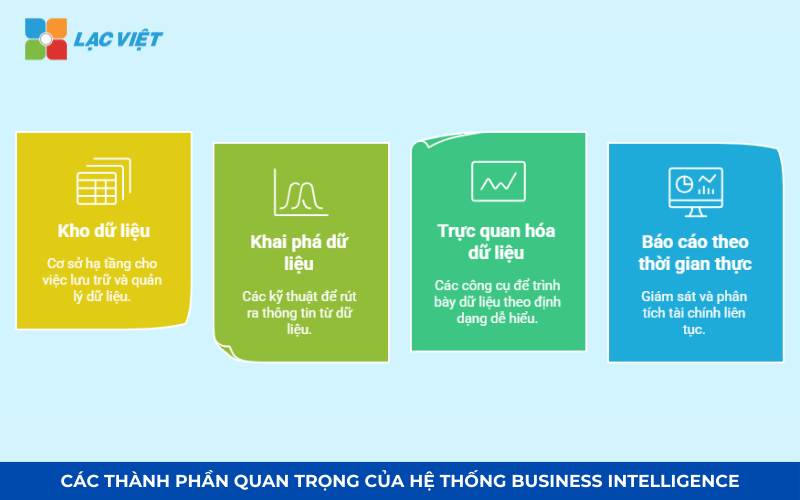
3.1. Data Warehousing (data Warehouse, BI)
Data Warehouse (DWH) is a repository of data focused to help businesses integrate information from many different systems such as ERP, CRM, accounting software, data transactions, banking, software supply chain management.
Data Warehouse ensure that the entire financial data in business are standardized, sync and storage system, which helps BI analytics for fast, accurate.
3.2. Data Mining/Machine Learning
Data Mining is the process of data mining, detection of sample data, the trend potential from big data. When combined with Machine Learning (ML) and AI, the system can automatically predict risks, business opportunities, optimize business finance.
The role of AI and Machine Learning in BI
- Trend detection auto finance: AI can analyze millions of lines of data to identify the new business trends, predict customer needs, detect financial risks.
- Forecast financial intelligence: Machine Learning helps to predict cash flow, revenues, operational costs in the future based on historical data.
- Automatic detection of financial risks: AI can scan the accounting data, the detection of spending irregularities, alerts the possibility of losing balance the budget.
3.3. Data visualizations (Data Visualization)
Data Visualization is the process of presenting financial data in business as a chart, graph, heat map (heatmap), dashboard mobile, helping CEOS, CFOS easily track analysis without the need to see a table of data complexity.
The role of data visualizations in BI
- Increase the ability to read out the data: Instead of watching thousands of lines of data, chart visual to help businesses quickly identify financial trends, revenue, cost.
- Help out faster decisions: A dashboard financial activity can provide information in real time, help in business decision-making in just a few minutes instead of waiting for the daily report.
- Easy compare and track KPI financial: BI helps businesses compare business results each month, quarter, year, from which adjust the strategy in a timely manner.
3.4. Dynamic reporting and data analysis in real time
Dynamic reporting allows businesses to customize and update financial statements immediately, instead of having to wait until the end of the month, end of quarter.
For example: CFO can see fluctuations in cash flow in real time, thereby quickly adjust the budget.
Benefits of data analysis in real time
- Update business information instantly: Help CEOS, CFOS decisions faster by 40% compared to model traditional reports.
- Detect risks early: BI can alert when revenues fall sharply, the cost increases abnormally.
- Optimize financial performance: Business can adjust the business strategy immediately instead of waiting for monthly reports.
4. The common applications of Business Intelligence in the enterprise
BI tool supports not only financial statements but also can apply extensive in many areas of business, from financial management, sales, marketing to supply chain operation. Applying BI to help optimize the decision-making process, enhance performance, reduce risk. Here are the important applications of BI in the enterprise.
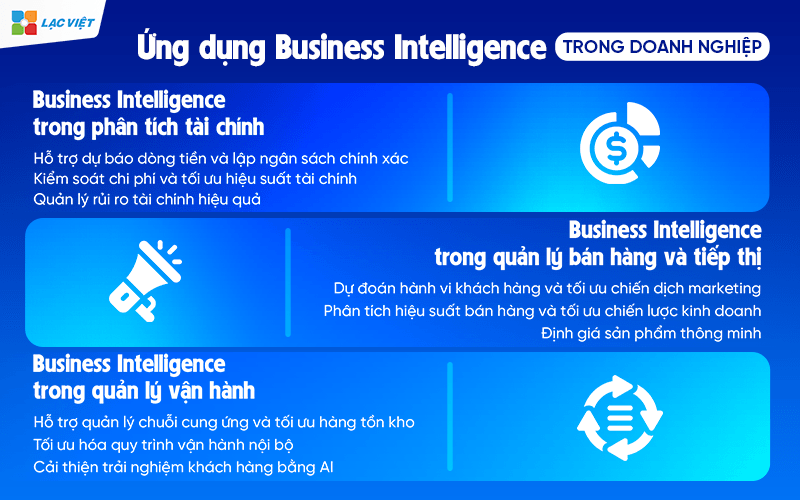
4.1. Business Intelligence in the financial – accounting
Financial analysis is one of the most important applications of BI, helping business, financial management, accurate, optimize cash flow, minimize risk.
Support, cash flow projections, budgeting accuracy
- Business Intelligence helps business cash flow analysis in real time, providing financial reporting to CFO can adjust the flexible budget.
- AI in BI can predict fluctuations in cash flow based on data history, help businesses be more active in the plan raise capital or optimal debt management.
Cost control, optimal financial performance
- BI helps automate the process of expense tracking, comparing actual costs with the budget expected to detect the expenditures exceeded.
- AI in BI can propose the optimized operating costs, reduce waste without compromising on performance.
According to research by Deloitte, the business app can reduce 35% of errors in financial statements, thanks to the ability to automatically cross-check accounting data, detect anomalies.
Risk management financial efficiency
- BI can analyze market volatility, exchange rate, interest rate and other risk factors to warn businesses about the risk of financial potential.
- Algorithms, Machine Learning can detect fraudulent transactions, errors in bookkeeping, helping businesses avoid the losses should not be.
4.2. Business Intelligence in management, sales and marketing
BI plays an important role in the analysis of customer data, optimize marketing campaigns to improve sales performance.
Predict customer behavior optimization marketing campaign
- Business Intelligence helps businesses analyze customer data from multiple sources (website, CRM, social networking, email marketing) to predict purchase behavior.
- AI can classify customers according to behavior, preferences, thus helping businesses personalize marketing campaigns, increase sales performance.
According to Harvard Business Review, business use MARBLES in marketing can increase conversion rates by up to 25% thanks to the ability to target customers more precisely.
Analyze sales performance optimal trading strategy
- BI helps track sales by each product, by region, and from there evaluate sales channels are most effective.
- BI system can propose suitable products based on data, purchase history, help your sales team increase in the proportion of pegs menu.
Product pricing smart
- BI can analyze the price changes according to seasonality, customer behavior, competitors, from which the proposed strategy, the optimal price.
- The AI algorithm in BI helps businesses automatically adjusting prices according to supply and demand, the optimal profit.
4.3. Application in operation management
BI helps businesses optimize their supply chain, improve operational efficiency, reduce response time to customers.
Support, supply chain management, optimal inventory
- BI helps business forecasting product demand, optimal plans to enter the restaurant to avoid inventory excess or shortage of goods.
- BI system can monitor the performance of suppliers, quality assurance, delivery schedule.
Optimized operation process, internal
- BI can analyze employee performance, productivity, thus helping the business to improve operating procedures.
- BI system helps to monitor the activities of each department in real time, ensure the indicator KPI is maintained at an optimal level.
Improve customer experience with AI
- BI helps businesses track customer feedback, the processing time required, from which optimized support services.
- Chatbot AI in BI can automatically respond to the common question, reducing the pressure for the customer care department.
4.4 Business Intelligence in manufacturing
BEARING support production department not only track progress but also performance measurement, cost control, optimal inventory.
Specific application:
- Track productivity of machinery, actual capacity, with the design capacity according to ca/usa/yard.
- Analysis of production costs on each unit of product development is extraordinary points.
- Manage inventory of raw materials and finished products take warning as to the need to enter or are in excess.
- Reviews efficient use of raw materials – gradations – waste.
Values bring:
- Reduce the waste of raw materials, the production time.
- Improve efficiency of operation and maintenance equipment.
- Support production committee decision-making process improvements in a timely manner.
Illustrative example: A company manufacturing electronic components to use BI to detect ca production night has error rates higher than 20% compared with day shift – from which rearrange shifts and training personnel more reasonable.
4.5 Business Intelligence in hr
BI in the help HR departments moved from administrative roles to strategic consulting, by providing quantitative information about people.
Specific application:
- Track employee performance, the number of hours worked, the rate of completion of the work, associated with KPI.
- Analysis of personnel costs by department, project.
- Reviews rate the holiday, engagement and movement of personnel.
- Analyze the effectiveness of the training program, internal.
Values bring:
- Help decision-recruitment – retention – rotated personnel have supporting data.
- Determine the location are high performance to replicate.
- Responding to risk personnel (example: rate the holiday a sudden increase in a department).
Illustrative example: A business use BI to track trends stay the increase in the fourth quarter, from that early deployment policies loyalty bonus, discount 30% cost recruitment.
Business Intelligence is not just a tool for data analysis. When properly implemented, BALLS become eyes, chain strategy in the whole system of decision-making of the business. From finance and marketing to production, personnel – every department can benefit from access to transparent data analysis – easy to understand – timely action.
5. The step deployment system for Business Intelligence in the enterprise
Step 1. Clearly identified needs, a problem that needs solving
This is a step platform, but many businesses overlook or make vague. Practical Business Intelligence is not a tool to “see” which is to solve one or more problem specific of the business.
Identify the right problem will help the business avoid investment in waste, build BI system in accordance with the goals of use, not rambling
How effective:
Listed difficulties or the information needs of each department. For example:
- Finance want to track the money line in day?
- Sales want to know what products bring the profit margin, the highest in the region?
- The director wants to have reported overall business situation every morning?
Transfer these needs of mathematical analysis.
For example: how to combine accounting data + warehouse + CRM to know effective sales according to each channel?
Step 2. Building the data warehouse (Data Warehouse) fit
Data warehouse is the center of the BI system, where the set and standardize all data from the business systems (accounting, sales, production, hr,...). Depending on the size of the business, there are 2 options:
Database simple (Mini DW):
- Collection of data from 2-3 sources, such as accounting software, CRM, Excel, internal
- Fits small and medium enterprises
- Can rapid deployment, cost savings initial
Database full (Enterprise DW):
- Designed stratified data
- Catering business has multiple departments, branch, or need to analyze data in depth
- Need technical team and the time investment
Important note: Whether at any level, data put into the warehouse all need to be cleaned – emirates – are standardized code. A little mistake in this step can make the entire analysis is then false.
Step 3. Selection of BI tools in accordance with capacity business
Not BI tool would also suit any business. Choosing the right platform to help optimize cost, easy to deploy, easy to extend.
Some popular choices:
- Power BI (Microsoft): Suitable businesses have used Microsoft 365. Friendly interface, easy to integrated with Excel, Microsoft ecosystem. Reasonable price, many features strong
- Tableau: Fit business has a team of data analysis, in-depth, Intuitive, culture, beautiful, customizable, powerful, higher Cost, need technical
- Looker (Google): integrate well with the ecosystem, Google Cloud, suitable business has transformed some depth on the Google platform
- BI platform localization available integrated accounting/inventory/ERP. LV Financial AI Agent – platforms, financial analysis, management, integrated BI report for business English. Advantages: Data accounting – inventory – sales automatically sync, don't need IT team deploy
If the business you have to have a team of BI professionals, let's start with tools, easy to use – reasonable cost – integrate available data to test and expand later.
Step 4. Deploy prototype (PoC) – staff Training – expanding the business
Deploy prototype (Proof of Concept – PoC):
- Select a department (e.g., financial) or a problem specific (cash flow, sales...)
- Deploy BI for the right needs it
- Test reports, get feedback, adjust
Internal training:
- Though powerful tool to where, if the user does not understand – not used – then BEARING failure
- Need short-term training for management, accounting, sales staff... how to read and mining BI
Extension:
- The following PoC is successful, could expand to other departments
- Building systems, synthesis report, related departments
- Constant updates KPI new phased development
Deploy Business Intelligence should not be started from the tools – but must start from the problems of the business. When properly implemented, COMPASSION not only helps enterprises “are beautiful statements,” which also brings the ability to make decisions accurately and quickly, more active before market movements.
6. The BI tool, which is the most used today
Here are four BI tools today's top rated high on the ability to visualise data analysis, advanced financial and forecast business trends.
6.1. Vietnam Financial AI Agent – BALL smart finances for business English
Vietnam Financial AI Agent is BI tools first in Vietnam, in-depth financial analysis, forecasting, risk, optimize cash flow help businesses automate financial reports, decisions faster.
Feature highlights
- System financial reporting standards IFRS/VAS.
- AI analysis, financial health, detect cash flow risks.
- Visualizing data with dashboard dynamic, interactive charts.
- Integrate data from AccNet, SAP, accounting systems and ERP.
Advantages:
- Automation, financial statements, time-saving handling of materials.
- Optimal cost compared to other BI tools abroad.
- Support English, in accordance with Vietnamese enterprises.
Cons: Not support data analysis in addition to the financial sector.
Suitable object: Vietnamese Enterprises need to optimize the financial statements according to IFRS, VAS.
The cost
- Basic package: 500.000 – 1.000.000 VND/month.
- Advanced package: According to the scale business.
6.2. Power BI – BI Solution, strong from Microsoft
Power BI is one of the platforms, data analysis, visualization, BI, the world leading development by Microsoft. With the ability to integrate AI, connecting data from multiple sources, visualizing financial information, real-time Power BI helps business improve financial performance, optimize the decision-making process.
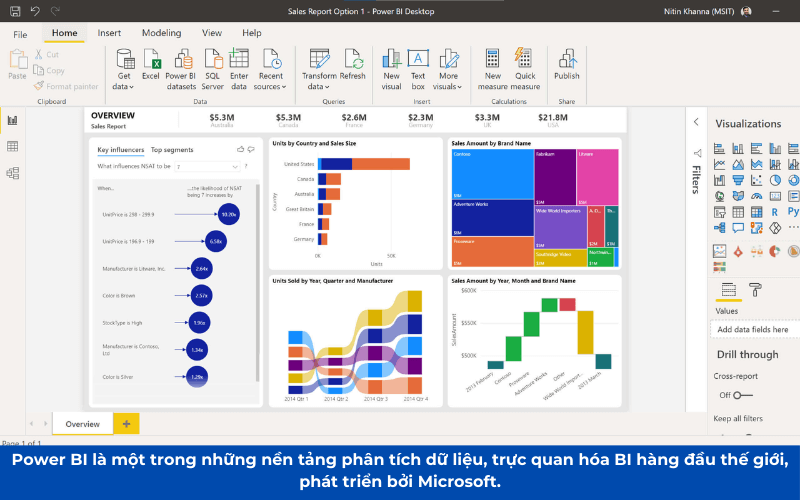
Feature highlights
- AI-driven Insights: Use AI of the Microsoft Azure to detect financial trends, to detect abnormalities in the expenditure cash flow projections.
- Data visualizations powerful: Provides dashboard interactive chart of CFO, chief accounting easy finance tracking.
- Integrated with Microsoft ecosystem: connect directly with Excel, SQL Server, Dynamics 365, SAP, AccNet.
- Dynamic reporting and analysis in real time: to Help businesses update fluctuations immediate financial support, budget control more accurate.
| Advantages | Cons |
|
|
Suitable object
- Medium and large business in need of financial analysis in-depth.
- The company uses Microsoft ecosystem, want to optimize financial data.
The cost
- Power BI Pro: 9.99 USD/person/month.
- Power BI Premium: 20 USD/person/month or 4.995 USD/month for big business.
6.3. Tableau – BI tools intuitive for business
Tableau is a BI tool leading visualization data analysis, finance, particularly strong in handling big data (Big Data), and financial forecast by AI. Developed by Salesforce, Tableau consistent with the business wants to tap in-depth data to make business decisions.
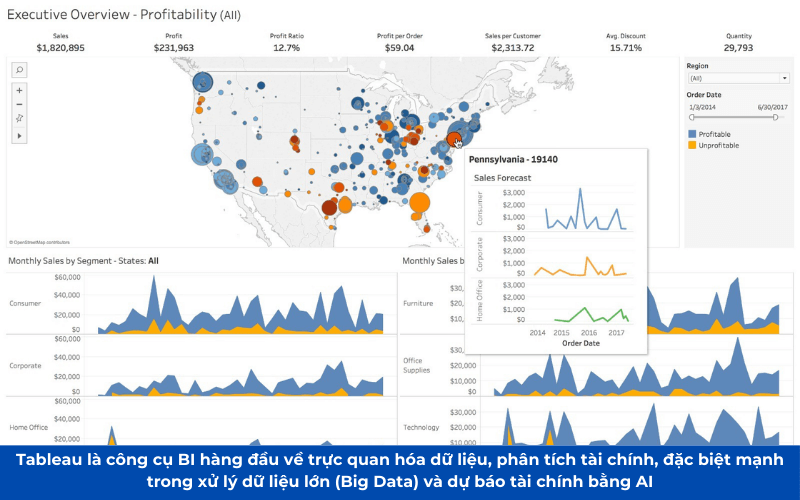
Feature highlights
- Integrated AI Einstein from Salesforce: Support financial forecast, detect trends, revenue analysis, financial risk.
- Handle big data, powerful: business Suits have big data systems need in-depth analysis.
- Data visualizations top: Provided dashboard, automatic chart customized according to the needs.
- Strong connection with the finance platforms such as SAP, QuickBooks, Oracle.
| Advantages | Cons |
|
|
Suitable object
- Big business need financial analysis, in-depth trend forecasting.
- Companies already using Salesforce CRM.
The cost
- Tableau Creator: 70 USD/user/month.
- Tableau Explorer: 42 USD/person/month.
- Tableau Viewer: USD 15/person/month.
6.4. Looker – BI on platform Google Cloud
Looker is BI platform powerful of Google Cloud support, analyze financial data in real time, especially suitable for business use Google Cloud and BigQuery.
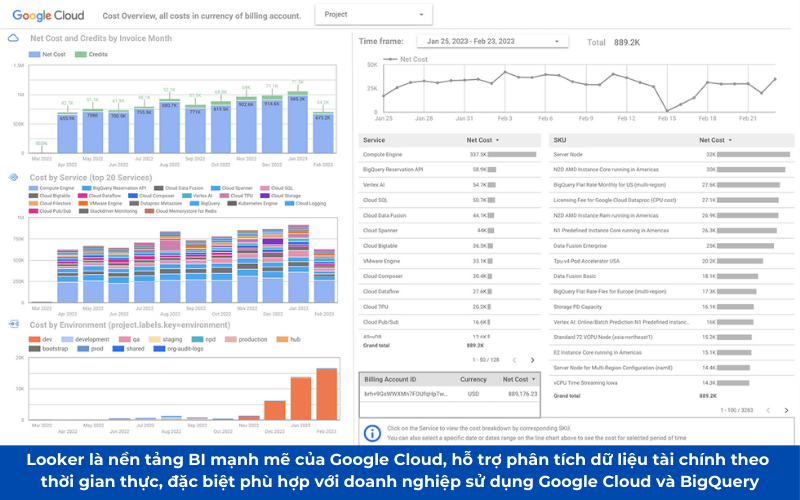
Feature highlights
- Connect directly with BigQuery: to Help businesses analyze big data in real time.
- Integrated AI/Machine Learning: Support financial forecasting, trend analysis, business.
- Handle financial data with SQL: allows businesses To write SQL queries directly to an in-depth analysis.
| Advantages | Cons |
|
|
Suitable object
- Businesses have the volume of financial data using Google Cloud.
- Technology companies, banks, insurance should handle financial data intensive.
The cost
- Average cost: 30 – 100 USD/person/month.
- Package big business: from $ 5,000 upwards.
With the strong development of BI, the business can choose BI tools suitable to enhance financial performance, optimize cash flow, minimize business risk.
Business Intelligence no longer is a dedicated tool for large corporations, which have become an important solution to help any business process optimization, finance, cash flow management, decision more accurate. If your business has implemented BI, this is the right time to start leveraging the power of data to create a break in financial management and business strategy!


![[ĐẦY ĐỦ] Mẫu báo cáo tài chính, tình hình tài chính file excel theo Thông tư 200 và 133](https://lacviet.vn/wp-content/uploads/2025/04/mau-bao-cao-tai-chinh.png)