
In the digital era, data is not only important resource, but also is considered “new gold” of the business. However, to extraction of maximum value from data, businesses can't just stop at the gathering that need to use the tools data analysis modern to handle and transform data into valuable information. These tools not only support business capture trends, optimize performance, but also opens up opportunities for strategic decisions based on the platform accurate data.
This article Lac Viet will introduce the details about the software data analysisfrom basic concepts, the benefit highlights, to the list of common tools, as well as choosing appropriate tools for each type of business. If you are looking for solutions to improve processes, data analysis, enhance competitiveness, this is the article you can't ignore.
1. Tool analysis what is data?
Tools data analysis is the technology solutions designed to support business processing, analysis and visualization of data. These tools help to transform the raw data, complexity of the valuable information, support business decisions correct strategy quickly.
Specific:
- Data processing: Integrate, cleanse, standardize data from many different sources.
- Data analysis: Create reports, charts and predict the trend for businesses to understand more about the performance.
- Visualization: Display data through the dashboard easy to understand help the user does not need in-depth expertise can still capture quickly the information.
Software data analysis plays a role as a bridge between data and business decisions. Some of the prominent role include:
- Optimize business performance: To help businesses detect the growth opportunities, optimize resources.
- Advanced financial capacity: Technical financial analysis business accurate, given the reasonable forecast for the budget, cash flow.
- Improved customer experience: Analyze customer behavior to improve the marketing strategy, strengthen the satisfaction of customers.
2. The type of analytical tools common data
In the context of technology development, the tools, data analysis increasingly varied according to the purpose of use. Here are three types of main tools:
2.1. Tools to analyze business data (Business Intelligence – BI)
Business intelligence focusing on collect, analyze and display data to support strategic decisions.
Characteristics:
- Easy to use with intuitive interface.
- Support integration of multiple data sources (CRM, ERP, accounting software).
- Create automatic reports, updated in real time.
For example:
- Microsoft Power BI: Create the dashboard dynamic analysis is effective for large organizations.
- Tableau: Strong in data visualizations with the chart type complex.
2.2. Tools, data analysis, financial accounting
Designed specifically to support finance department of accounting in the management of data related to the budget, revenue, expenses, cash flow.
Characteristics:
- Support detailed analysis financial indicators business as profits, debts, cash flow.
- Forecast financial trends based on historical data.
- Provide high security features to protect sensitive information.
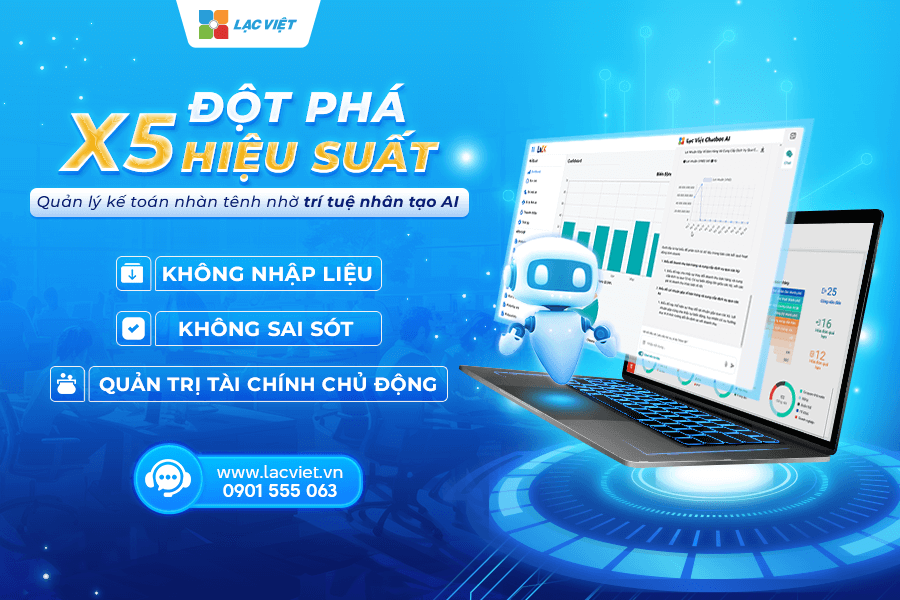
For example: Financial AI Agent of Lac Viet: Integrated tools AI to analyze accounting and financial support, queries financial data in real time, forecast financial trends.
2.3. Tools, big data analytics (Big Data Analytics)
These tools focus on the processing of the data analytics giant, which is often used by businesses large scale or in the field of research.
Characteristics:
- Handle large data volumes with high speed.
- Integrated AI/Machine Learning to advanced analysis.
- Good scalable, consistent with the long-term project.
For example:
- Apache Hadoop: Handle large data dispersion, in accordance with the business in the field of research or technology.
- Google BigQuery: Focus on handling large data on the cloud platform to support the business, ecommerce, advertising.
Tools to analyze data not only support business process optimization, data management, but also help them to transform data into practical value. Choosing the right tool will depend on the specific objectives and the scale of each business.
3. Software data analysis has the feature highlights how?
3.1. Integrated multi-source data
Tools data analytics allows businesses to integrate data from many different sources, including ERP systems, CRM software, accounting software, database internally. This feature helps the whole set of business data into a single platform to minimize the fragmentation of information, process optimization analysis.
Benefits:
- Data synchronization: Easily access data from different departments to ensure consistency integrity.
- Reducing processing time: Integrated automatic data save time entering data manually.
- Increase effective collaboration: The departments have access to the same data set, from which enhance coordination ability.
3.2. Real-time analysis
The ability to real-time analytics allows access business data processing immediately when there are changes. This is especially important in the industry requires fast reactions, such as finance, production, or commerce.
Benefits:
- Feedback quickly: Leadership can be based on data update to take out the instant decision.
- Track KPI constant: Businesses can monitor the performance without waiting synthesis report.
- Detect troubleshooting: Support identification, timely issues, as sales decline, or the cost spike.
3.3. Data visualizations
Tools data analysis is now focused on data visualizations to help users easily understand, analyze information through charts, tables, figures and dashboard.
Benefits:
- Display information visually: Complex data are expressed as diagrams, graphs help the user to easily recognize trends.
- Custom report: Users can design dashboard tailored to the individual needs of each of the departments.
- Enhance decision-making abilities: Data visualizations help leaders understand the overall picture. make decisions quickly.
3.4. Forecast analysis advanced
Integrated artificial intelligence (AI) and machine learning (Machine Learning) into software data analysis help businesses not only look back at past data but also predict trends in the detection of abnormalities in the future.
Benefits:
- Trend analysis: Help businesses predict customer demand, revenue, or expense in the future.
- Anomaly detection: AI help identify the index of unusual, such as financial fraud or error in supply chain.
- Optimization strategy: The analysis predicts allows businesses to adjust strategies to achieve goals more efficiently.
3.5. High data security
Enterprise data always contain sensitive information, so the tool data analysis need to ensure high level of security include data encryption, access subdivisions, track a user's activity.
Benefits:
- Prevent data leakage: Protect sensitive information such as financial information, customer.
- Management access: Only those who have the right to be allowed access to specific data.
- Regulatory compliance: Ensure business compliance with the security standards as GDPR or ISO 27001.
The striking features such as integrated multi-source, real-time analysis, data visualizations, advanced analysis and high security have helped the analysis software data become indispensable solution in business activity. The effective use of this tool not only helps business process optimization, commissioning, but also create competitive advantages sustainable in the market.
4. 7 software/tools, data analysis, integrated AI for business
Tools such as Microsoft Power BI, Tableau, Google Data Studio, Financial AI Agent, … bring the optimal solution in the data analysis. Depending on the needs and scale, businesses can choose the right tools to optimize the decision-making process, improve business performance, increase competitiveness on the market.
Here is the detailed comparison 7 software, data analysis, business details.
| Software name | Feature highlights | Restrictions | Package price |
|---|---|---|---|
| Financial AI Agent of Lac Viet |
|
|
Contact for details |
| Microsoft Power BI |
|
|
|
| Tableau |
|
|
|
| Google Looker Studio (formerly Google Data Studio) |
|
|
For free. |
| Python (with Pandas, NumPy, Matplotlib, Seaborn...) |
|
|
Free (open source). |
| R (with ggplot2, dplyr, Shiny, Tidyverse...) |
|
|
Free (open source). |
| SAS (Statistical Analysis System) |
|
|
Depending on the business needs, there is a trial version. |
| IBM Cognos Analytics | – AI assistant hint insight automatically using natural language – Create reports, charts and dashboard actions – Data storytelling, AI to detect trends and anomalies – Connect multi-source data (Excel, SQL, cloud) – Decentralization and security |
– Interface initially somewhat complicated with non-professional – The cost can be high with AI full – Need engineering team to optimize access big data |
– Basic: From $10.6/user/month – Standard: From $40/user/month – Enterprise: Customized according to the needs – Free trial: Available |
| Qlik Sense | – Data analysis, non-linear with Associative Engine – Insight Advisor AI hint chart, quick analysis – Construction dashboard drag & drop – Customizable power via API – Built-in Python/R, handle big data, flexible |
– High cost for small business – Slightly difficult to use with the new due to more advanced features – Need to learn to harness optimal link data |
– Business: $30/user/month – Enterprise: quotation according to the number of users and deployment own – Free trial: 30 day full feature |
| RapidMiner | – Data analysis and machine learning, no programming required – Workflow visualization with more than 1,500 jaw and pattern – Process automation AutoML – Connect data from Excel, SQL, cloud, big data – Modeling and deploying prediction fast |
– Free version restricted the amount of data (10,000 lines) – Not about visualization as Power BI/Tableau – Reduced performance if there is no hardware strong enough |
– Free: 0₫ (limited data) – Small: ~$2,500 per year – Professional: ~$10.000/year – Enterprise: Customization, configuration, support internal implementation |
4.1. Financial AI Agent of Lac Viet
Financial AI Agent is tools of financial analysis, accounting intelligence is developed by Lac Viet, integrate AI to assist enterprises in the query, data analysis, real-time financial.
Feature highlights:
- Analysis of financial statements company depth: Provide financial reports automatically as the balance sheet, cash flow, debts and profits.
- Support real-time query: Reply queries using natural language, such as “cash Flow available current is how much?” or “revenue of months ago?”.
- Trend forecasting: Use AI to predict the financial volatility based on historical data.
- Visualization report: Display data as a chart, easy to customize according to the needs of each department.
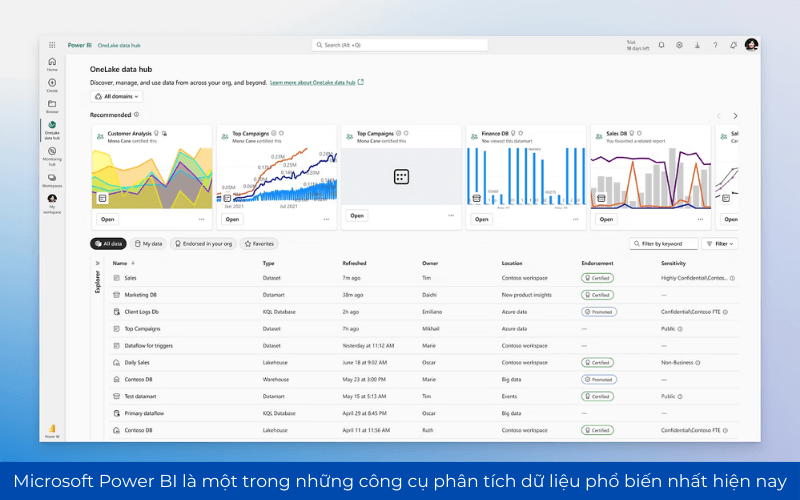
4.2. Microsoft Power BI
Microsoft Power BI is an analysis platform data visualization developed by Microsoft to help businesses harness and display the data in an intuitive way. This tool is designed to transform data into the report intuitive, easy to understand without the need for programming skills intensive.
With the ability to integrate tightly with other Microsoft products such as Excel, SQL Server, Azure, and SharePoint, Power BI becomes a powerful solution for businesses that are looking for tools, data analysis, flexible, easy to deploy.
Feature highlights
- Connect multi-source data: Power BI can connect to more than 100 different data sources, including the internal database, cloud services, API, data files such as Excel or CSV helps to synthesize data from multiple sources on a single platform to analyze.
- Data visualizations optimized: Power BI offers a variety of tools, data visualizations such as bar charts, line charts, heat maps, pie charts and different types of dashboard interactivity to help users easily capture the trend.
- Integrated AI and Machine Learning: auto, data analysis, suggestions trend potential to help businesses make decisions more accurate without the need for manual intervention.
- Create a report action in real time: Business can set the dashboard, reports, automatically updated in real-time to track performance, operations, finance, sales without the need for processing data.
- Data security at enterprise level: Power BI supports the privacy policy, strict control access to data at each level in accordance with the organization to manage your data safe.
Weakness
- Limited features in the free version: the free Version only in accordance with individuals or small groups. To deploy across the enterprise, need to buy the Pro or Premium.
- Configuration requirements computer: When processing large data volumes, Power BI can ask the hardware configuration to ensure smooth performance.
- The ability to manipulate data limited compared to Python or SQL: For the data analysis, in-depth, Power BI can not powerful enough as the programming tool other analysis.
Application in the analysis of business
Power BI helps businesses handle data analysis in many different ways:
- Financial analysis: track cash flow, revenues, costs, profits via dashboard actions.
- Optimize sales performance: analysis of customer data, determine the shopping behavior to help businesses take out sales strategies effectively.
- Track KPI performance hr: can set up reporting systems, performance tracking, personnel, project schedule, work productivity, help manage optimal process operation.
- Detection risk business trends: Thanks to the ability to analyze real-time data, Power BI helps business to quickly detect the potential risks, market trends in order to adjust the strategy in a timely manner.
4.3. Tableau
Tableau is one of the tools to analyze data visualizations today's most powerful, is the small and large enterprises worldwide trust. With the ability to handle fast data visualization data-intensive, Tableau helps businesses easily turn raw data into charts, reports, dashboard full of information. Tableau is appreciated thanks to the drag-drop interface intuitive help users don't need programming can still perform the complex analysis.
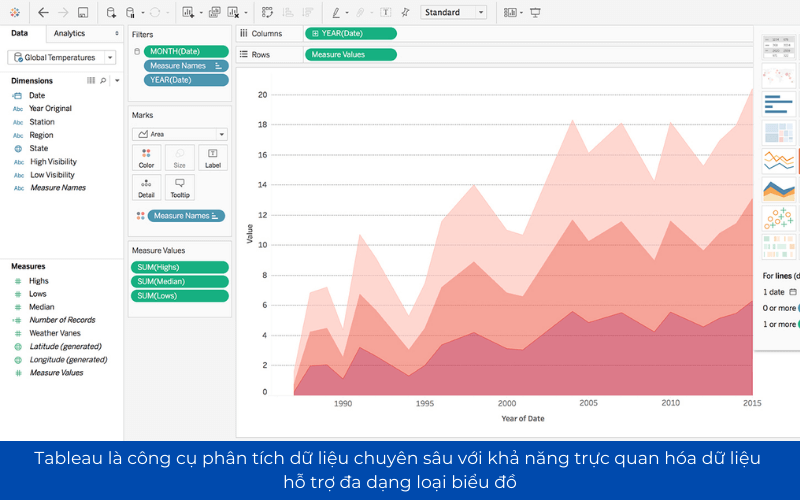
Feature highlights
- Data visualizations depth: display data in many different formats, from the chart, column chart, to heat, to a geographical map that helps business data mining in different angles.
- Process big data quickly: With processing technology, in-memory strong, Tableau can analyse millions of lines of data without slowing down the system. Useful for businesses that have large data such as banking, e-commerce, supply chain.
- Integration with multiple source database as popular as MySQL, SQL Server, Google BigQuery, AWS Redshift to help businesses easily aggregate mining data from many different systems.
- Create a dashboard dynamic and interactive: easily create dashboard which allows filtering the data, change the angle of view analysis data in a flexible manner without the need to update the report.
- Support advanced analytics with Python and R: implementing predictive analysis, statistics, in-depth service forecast models, data optimization.
Weakness
- The cost is higher than other tools: Tableau priced quite high, especially version of Tableau Server for business. Can be barriers to the small business or startup.
- Require users to have knowledge of data analysis: although the interface is drag-and-drop friendly, but to harness the full power of Tableau, users need to have knowledge about data analysis, the principle of visualization.
- Performance can decrease when handling big data: When working with a huge amount of data, if not optimized properly, Tableau may experience performance issues.
Application in the analysis of business
Tableau is the ideal tool to analyze, visualize business data in many different fields:
- Data analysis customers: tracking customer behavior, market segmentation, performance marketing campaign to optimize trading strategies.
- Performance analysis sales: track sales, number of orders, the trend of shopping to bring out the strategic decision-making in business.
- Track the supply chain: With the ability to visualize data by geography, business can analyze supply chain, process optimization, shipping and inventory control more effective.
- Trend forecasting business: Thanks to the integrated Python and R, businesses can build models to predict sales, demand, market trends, consumer, from which actively in decision-making.
4.4. Google Looker Studio (formerly Google Data Studio)
Google Looker Studio is a visualization tool reports data for free of Google, allows businesses to aggregate, analyze, present data in an intuitive way without the need for programming. With the ability to strongly integrated with the platform of Google such as Google Analytics, Google Ads, Google BigQuery, as well as many sources of external data, Looker Studio helps businesses easily create dynamic reporting, tracking index, business in real-time and quick decisions based on data.
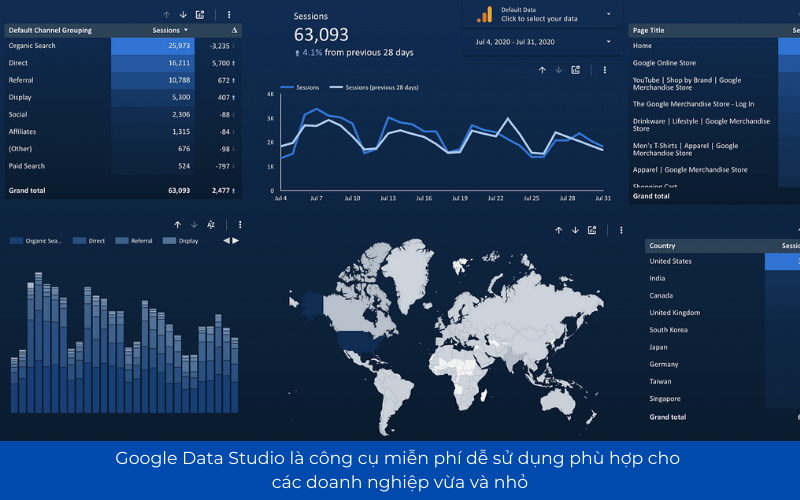
Feature highlights
- Free – easy to use: unlike many analytics tools other data requires high cost, Google Looker Studio completely free interface, drag-and-drop visual suit all those who do not have the expertise in-depth data.
- Integrate diverse data source: Support connection with more than 800 different data sources, including Google Sheets, MySQL, PostgreSQL, Facebook Ads, HubSpot, and more data platform other business help business easy collection of data from many different channels to comprehensive analysis.
- Create dynamic reporting, easy interactive: users can easily build dashboard custom, apply filters, actions, generate reports in real time to track business performance in a flexible way.
- Share collaboration easy: The reports can be shared via a link, embed in website or export PDF help team in business can work together without the need for particular software.
Weakness
- Ability to analyze data enhancement is still limited mainly focused on visualization, and general data, there are other features, statistical analysis or forecasting models as tools other intensive (Python, R, Tableau).
- Performance can decrease when handling big data: When connecting to data sources have large number of records, the loading speed reports can be slow, especially if the data is not optimized before putting on Looker Studio.
- Missing features support automatic data cleaning: Looker Studio no tools internally to handle the data, or remove outliers, so the business need to process the data prior to analysis.
Application in the analysis of business
- Track business performance in real time: Business can connect Looker Studio with system sales, website or advertising to track revenue, number of orders, conversion rate, without the need to update data.
- Report marketing multi-channel: can aggregate data from Google Ads, Facebook Ads, YouTube, a website on a dashboard only to analyze the performance advertising campaigns.
- Analyze customer data: mining information from Google Analytics to identify user behavior, average time on page, bounce rate, page, from which optimal customer experience.
- Financial reporting simple: connect with Google Sheets or accounting system, business can create a report overview of revenue, costs, profits without the use of financial software complex.
4.5 Python (with Pandas, NumPy, Matplotlib, Seaborn...)
Python is one of the programming languages most popular in the field of data analysis, artificial intelligence. With ecosystem rich library such as Pandas (data processing), NumPy (numerical computing), Matplotlib and Seaborn (data visualizations), Python allows businesses to perform the data analysis, from simple to complex, including financial forecasting, optimization, supply chain, analysis of customer behavior.
Feature highlights
- Handle data cleaning: With Pandas, businesses can easily clean the data, remove duplicate values, the fill value is missing, standardize the data prior to analysis.
- Big data analytics: NumPy and Pandas help handle millions of lines of data without affecting performance to help businesses harness large-scale data efficiently.
- Data visualizations flexible: Matplotlib and Seaborn offers many tools to create chart to help businesses easily compare trends, detect anomalies in the data.
- Integrated with AI/Machine Learning: combined with libraries like Scikit-learn, TensorFlow to build models to predict, customer classification, forecasting, sales or detect financial fraud.
- Automate process analysis: programming automate the process of collecting, processing report data to help businesses save time, improve work performance.
Weakness
- Requires programming skills: Other with Power BI or Looker Studio has an intuitive interface, Python requires personnel to have knowledge about programming, data analysis to extraction efficiency.
- Not available reporting interface: Python is mainly analysis tool, there is no available interface presentation professional report such as Power BI or Tableau, unless integrated into the Dash or Streamlit.
- Not instant solution: Python accordance with data analysis, in-depth long-term rather than the quick reports in real time.
Application in the analysis of business
- Analysis financial forecasting revenue: processing, data analysis, finance, calculating profits, revenue forecast over time to help businesses make business plan more accurate.
- Optimized supply chain: The company manufacturer or trade can use Python for data analysis, inventory forecasting market demand and optimize logistics operations.
- Analyze customer behavior: By tapping data from the sales channel, social network, business can build models to predict customer needs help personalize marketing strategy.
- Detect financial fraud: Python can use the algorithm of machine learning to detect unusual transactions in the banking, insurance helps to minimize the risk of fraud.
4.6 R (with ggplot2, dplyr, Shiny, Tidyverse...)
R is one of the programming languages most popular for data analysis, statistics, is widely used in scientific research, finance, health. Unlike other visualization tool data such as Power BI or Tableau, R focus on handling complex data, statistical analysis in-depth.
With a rich ecosystem including libraries like ggplot2 (data visualizations), dplyr (data processing), Shiny (create interactive web apps) and Tidyverse (collection tool, data processing, modern), R help businesses harness data in a comprehensive manner to make decisions based on accurate data.
Feature highlights
- Statistical analysis of in-depth: R is designed to perform the calculations, complex statistics, such as linear regression, analysis of variance (ANOVA), analysis of time series forecast models. Useful for business that want to exploit historical data to make decisions based on scientific models.
- Data processing flexibility: With the library dplyr and Tidyverse, R easily clean, transform, aggregate data from various sources without the need to use the tools intermediate.
- Data visualizations strong: the library ggplot2 provides the ability to create custom charts to help businesses present data in an intuitive way, easy to understand than the reporting tool tradition.
- Construction application, data analysis, online: With Shiny, businesses can create interactive web applications to present data in a flexible manner without the need for programming web interface depth.
- Support the prediction model: deployment models, financial forecasting, trend analysis, sales, forecasting, customer needs, thereby optimizing trading strategies.
Weakness
- Requires knowledge of statistical programming: Not the same as Power BI or Google Looker Studio, R requires users to have a background in programming, understanding of data analytics to harness the maximum power.
- Performance, handling big data, has not optimal: When working with big data, R can have issues about speed than the engine is highly optimized, more like Python or Apache Spark.
- There is no user interface friendly: R works primarily on command line environment, or through tools such as RStudio, can cause difficulties for business no expert data analysis.
Application in the analysis of business
- Analyze financial data: stock price fluctuations, risk assessment, finance, build models, forecast revenue based on historical data.
- Market research: trends, shopping, customer surveys, assess the level of customer satisfaction through statistical models.
- Medical analysis; pharmaceutical: In the medical industry, R is used to analyze clinical data to predict the spread of disease process optimization study drug.
- Optimized supply chain: analysis of inventory data, to predict product demand and optimize logistics based on the actual data.
4.7 SAS (Statistical Analysis System)
SAS (Statistical Analysis System) is a software platform, data analysis, robust, widely used in large institutions such as banks, insurance, medical, and research institutions. SAS stand out thanks to the ability to handle big data, performed the statistical analysis of complex solutions provide advanced analysis according to standard business.
Unlike other free tools like R or Python, SAS is a commercial software premium is optimized to provide the solution data safe, reliable, easy to deploy at scale.
Feature highlights
- Statistical analysis of in-depth: SAS provides the tools to analyze data with powerful statistical models such as advanced analysis, forecasting, regression models, factor analysis and variance analysis to help businesses make decisions based on data have high accuracy.
- Processing big data with high performance: the ability to handle millions of records quickly, in accordance with the business of big data requires complex analysis.
- Integrates well with enterprise systems: connected with the management system, big data as SQL, Oracle, Hadoop help leverage data from various sources.
- Security compliance: meets the security standards, strict, especially in the financial sector – medical help businesses comply with the legal provisions related to data.
- Support artificial intelligence (AI) and machine learning (Machine Learning): SAS have the module advanced analytics help businesses deploy the model to predict, optimize business operations.
Weakness
- The cost is higher than the open-source solution such as R or Python, this can be a barrier for small businesses.
- Requires in-depth training: although SAS interface, graphics, user support, but to harness maximum power, businesses need to have employees who have experience or join the training course specialized.
- Not as flexible as Python or R: SAS can be limited in the customize or extend the functionality in comparison with the open source tool, especially when enterprises need to build analytical solution specialized.
Application in the analysis of business
- Analyze financial data bank: risk assessment, credit, fraud detection, transaction, predict market trends to give the investment strategy accordingly.
- Data analysis, medical, pharmaceutical: SAS is widely used in clinical research, data analysis, patients, optimal process of drug development.
- Risk management in insurance: insurance companies use SAS to analyze trends, claim, risk prediction optimize the value of the insurance contract.
- Optimized operating business: data analysis, commissioning, measure the performance of employees and optimization of trading strategies.
7. IBM Cognos Analytics
IBM Cognos Analytics is one of the software BI (Business Intelligence) first developed by IBM, with the goal of helping businesses transform raw data into strategic information. This tool combines the ability to visualize, analyze, describe, analyze, predict and AI to assist users to make decisions based on data, although they do not need knowledgeable technical depth.
Features advantages
- AI assistant integration (AI Assistant): allows users To enter queries using natural language such as “revenue July 6 in the North is how much?” the system will return the chart, data table, or KPI.
- Automatically detect patterns, trends (Pattern Detection): AI in Cognos have the ability to find out the anomaly or trend hidden in large data sets.
- Data storytelling (storytelling with data): allows For the creation chain slide intuitive with explanations automatically help reporting presented convincing.
- The ability to integrate flexible: connect to data from multiple sources: Excel, SQL, Oracle, Amazon Redshift, Google BigQuery, Microsoft Azure,... Support standardized data cleaning directly in the software.
- User administration, security, strength: in accordance with the organization to decentralize closely, multiple levels of approval and keep track manipulation.
Weakness
- The learning curve is relatively high: For the new people have never used a BI or not familiar with the data model need time to get acquainted.
- Investment costs can be high if using the advanced features such as Forecasting + AI Insight with large number of users.
- Slow response when processing the data extremely large if not, optimize the backend.
Application in the analysis of business
- Financial accounting: financial reporting, automatic expense tracking actual vs. estimates.
- Sales – Marketing: build dashboard tracking effective campaigns, sales by channel, customer behavior.
- Production – supply Chain: inventory tracking, production cycle, the forecast demand for raw materials.
- Strategic management: data analysis, KPI measurement, operational efficiency, multi-departments in real time.
The package price (reference from IBM and distributors)
| Package use | Description features | Reference price |
| Basic (Cognos on Cloud) | Standard reports, dashboard, basic AI support questions simple data | From $10.6/person/month |
| Standard (Cloud/On-premises) | Integrated advanced data, share data, features, automation report | From $40/person/month |
| Enterprise | Custom configure your own server, advanced security, connection systems, ERP/CRM, deep, AI intensive (beta) | Contact get a quote |
8. Qlik Sense
Qlik Sense is a BI solution, the new generation comes from Qlik highlights with technology “analysis data link” (Associative Engine), which allows users to explore multidimensional data that is not limited by linear patterns-traditional. Other than the tool as “query by structure”, Qlik enables “go from any point to any other point” in the data – helps to detect insight has ever seen.
Features advantages
- Associative Data Engine: Displays all the relevant market and not related when filter – something that the traditional BI does not do.
- Insight Advisor (AI support analysis): Hint chart, trend analysis automatically based on the data set are working.
- Construction of the chart, drag and drop (drag & drop): does Not require programming or SQL, in accordance with the office staff.
- Scalable, flexible: can be integrated with Python/R to build models ML in the dashboard.
- Automatic data updates (Scheduled Refresh): Data will be updated on a recurring schedule, no need to reload manually.
Weakness
- Price high to small business: By positioning for medium and large version cloud personal is limited.
- Need technical if you want to custom chart or integrated backend raise.
- Interface can be a bit “dense” with new people.
Application in the analysis of business
- Retail – fmcg: View sales by channel, cart, trend in real time.
- Medical – hospitals: analysis of patient, duration of hospitalization, the rate of use of hospital beds.
- Logistics – transportation: route optimization, delivery time, inventory intermediaries.
- Personnel: life cycle analysis, staff fluctuations, the holiday, the performance recruitment.
The package price (reference from Qlik)
| Package use | Description | Reference price |
| Qlik Sense Business | Cloud access, create and share dashboard simple support basic AI | From $30/person/month |
| Qlik Sense Enterprise | Install on-site or cloud, expand, system integration, security level organization | Contact (based on number of users & extension request) |
| Free trial | Trial full version for 30 days with full functionality | Free |
10. RapidMiner
RapidMiner is a cross-platform data analysis, model building, machine learning (machine learning) highlights thanks to the ability to visualize the analysis process does not require programming. Developed in Germany popular globally, RapidMiner is used by thousands of institutions in the financial sector, manufacturing, healthcare, and education.
Strengths the core of the software is workflow drag-and-drop (drag & drop) to perform the entire sequence analysis of data from pre-treatment (data wrangling), training the model, evaluating the results to implement the prediction.
Features advantages
- No need to write codes: drag & drop interface intuitive with more than 1500 algorithm and the function handle is pre-packaged.
- Ecosystem strong: connect directly with Excel, CSV, SQL, Hadoop, MongoDB, Amazon S3, SAP, etc.
- Library algorithm rich: machine learning algorithms: Decision Tree, SVM, Random Forest, Gradient Boosting, Naive Bayes, KNN, Clustering, Neural Network, etc. can integrate Python, R, or TensorFlow, if necessary, enhanced.
- Integrated AutoML: Hints for the best model based on the data, automatically select the optimal parameters and evaluate cross (cross-validation).
- Deploy models quickly: The analysis results can be exported as a report, dashboard or API integration to put into practical application.
Weakness
- Limited features in free version: the free Version limits the number of rows (10,000 lines), do not support advanced features such as AutoML or modeling deep.
- Not specializing in visualization: If demand is mainly generated chart visual reports (dashboard), Power BI or Tableau may be more suitable.
- Processing performance: With data extremely large (over 1 million lines), performance can be slow if not running on the server configuration.
RapidMiner fit with the business want to apply advanced analysis and forecast the future, but no team of engineers with in-depth data. Some common applications:
- Marketing & Sales: predict customer left, segment, customer analysis, purchase behavior, the probability pegs sale.
- Financial scoring, credit, detect fraudulent transactions, cash flow forecasting.
- Production – operator: Forecast malfunctioning equipment, optimal supply chain, root cause analysis error.
- Personnel: predict the rate of the holiday, optimal performance, recruitment, identify potential employees.
The package price (according to rapidminer.com)
| Package use | Main features | Price (reference) |
| Free | Workflow drag and drop; 10,000 lines of data; 1 user | Free |
| Small | A maximum of 100,000 lines; connection limitations; restrictions AutoML | From $2,500/year |
| Medium (Pro) | Unlimited data; AutoML; Integrated Python, R, APIS, full | From $10,000/year |
| Enterprise | Deploy a separate server; custom model pipeline; 24/7 technical Support | Contact us for a quote |
RapidMiner has policies to support academic free for schools and students at the same time have a cloud trial run for 30 days.
5. Choosing tools, data analysis, fit
Selection tool suitable not only help businesses optimize workflow but also enhance the ability to make decisions based on accurate data. The review needs specific features, cost and the level of ease of use are the important factors to ensure the tool fully meet current requirements as well as supporting the long-term development of the business.
5.1. Determine the specific needs of the business
To select the analysis tool suitable data, the first step is most important is to clearly define the specific needs of the business.
- The types of data to analyze: Business needs analysis of business data (sales revenue, profit, cost), or data, financial accounting (cash flow, debt, budget)? For example: A company e-commerce will need tools to help analyze customer behavior, while a manufacturing enterprise focused to analyze inventory and supply chain performance.
- Scale data, aim to use: With business SME, tools for free or low cost, such as Google Data Studio may be the right choice. Large enterprises need tools capable of handling large data such as Apache Hadoop or Tableau to meet the requirements of speed, efficiency.
5.2. Features the ability to expand
An analytical tool well need to have the flexibility and scalability to meet the development of the business.
- Assess the ability to integrate with the current system: Tools should integrate smoothly with the existing software, such as ERP, CRM, accounting software. For example: Financial AI Agent of Lac Viet has the ability to deeply integrated with the accounting system AccNet help enterprises easily deploy, manage financial data.
- The ability to expand as business grows: Tools to meet the demand growth in the scale of data and volume analysis. For example, Google BigQuery support extended automatically on the cloud platform, in accordance with the business processing big data in real time.
5.3. Cost and technical support
When choosing tools, costs, level of technical support from supplier, are important factors to consider.
- Compare the cost of deployment: Businesses need to compare the elements as free copyright, free to deploy, the other hidden costs. For example: the Tableau is the tool have a high cost, but bring great value on feature visualization, while Google Data Studio for free but in accordance with the small business.
- Service and technical support: Suppliers can provide 24/7 support no? Tools have to be updated periodically to feature enhancements, security't? For example: Financial AI Agent of Lac Viet provide support detailed technical consulting services customized for Vietnamese businesses.
5.4. Easy to use in accordance with the hr team
A tool for data analysis need to be friendly interface easy to use to all parts of business can apply without training too complicated.
- Reviews, interface documentation: The tool should have a simple interface, intuitive accompanied by the documents supporting details. For example, Microsoft Power BI, provides drag & drop interface friendly, documentation in full conformity with both users with no technical skills.
- Level easy-to-apply: Tools need to have automation features reduce dependence on our team of expert data analysis. For example: Financial AI Agent allows the user to perform the query data using natural language, help leadership easy to use without training deep.
6. Trends app analysis tool data in the enterprise
6.1. Apps, AI and Machine Learning
The combination of artificial intelligence (AI), machine learning (Machine Learning) in the tools data analysis is becoming an inevitable trend. These tools not only support data processing but also automate the process of analysis, thereby creating the forecast, hint, strategy, breakthrough.
Benefits highlights:
- In-depth analysis: AI can handle large volumes of data to detect patterns, trends that people hardly recognize.
- Automatic forecast: Machine learning allows businesses to predict the future outcomes based on historical data, which helps to plan more accurate.
- Personalization solutions: AI based on the individual characteristics of each enterprise or field of business.
For example: Insurance companies use AI to analyze customer profiles, detection of risk factors and proposed insurance products fit. Thus, they have to increase the rate of sales up 20%, reduce the rate of payment risk.
6.2. Combined with big data (Big Data)
Big data (Big Data) played a key role in promoting the efficiency of the analytics data. Businesses increasingly collect blocks a huge amount of data from many different sources such as website, social networks, IoT system, online trading. Tools data analysis now allows the handle to harness the value from the block data.
Benefits highlights:
- A quick analysis of the effect: Handle large volume of data to generate reports, insight value.
- Integrated multi-source: Data from many different systems are combined to create a comprehensive picture of business operations.
- Decision support: Discover the factors that affect performance, detect new opportunities from data.
>>> Read more about Data driven – The trend decisions based on data
6.3. Integrated in the strategic transformation of
Convert numbers are is a top priority of many businesses to enhance competitiveness. In this strategy, the software data analysis plays an important role to help businesses transition from traditional management to manage based on data.
Benefits highlights:
- Accelerates the decision-making process: The data is analyzed, provided when in need of help leaders take timely decisions more accurate.
- Performance optimization: These tools help improve operational efficiency by automation of the analysis report.
- Ensure transparency: Providing clear information reliable help business activity monitoring, risk management, more effective..
In the context of data is increasingly becoming the determining factor of the success of the business, the use of tools data analysis no longer is the option that has become necessities. From the support correct decisions, optimize business operations to forecast future trends, analysis tools role as “the digital brain” to help businesses lead in the market competition fierce.
Let's start using the right tool as Microsoft Power BI, Tableau, or Financial AI Agent of Lac Viet, step by step building strategy, data analysis efficiency. Invest in tools to analyze data privacy is invested in the success and sustainability of business in the future. Take action today to turn data into competitive advantage superior!