
According to McKinsey (2023), the organization applies the method to Data Driven increase of 23% business performance than organizations using traditional methods. However, neither organization would also know how to harness maximum power from the data to take strategic decisions and optimize business processes. This is the time to approach Data Driven – decisions based on data – become the inevitable trend for the modern enterprise.
This article Lac Viet will help you to understand the concept of Data Driven reasons why businesses should apply this method step by step deployment efficiency to maximize value from data, from which to create breakthrough in business activity.
1. Data Driven là gì?
“Data driven” – also known as data-driven – is approach in corporate governance, in which all decisions are made based on actual data instead of relying on gut feeling, personal experience or the assumed subjective. This is a platform that helps business to operate post more, respond more quickly to market changes, especially to minimize risks in the strategic decisions.
A business is Data driven, when they have the ability to:
- Collect data continuously from the touched point in the system: sales, finance, hr...
- Data analysis to find out the relationship, the trend, the cause of the problem
- Decisions based on evidence of data, rather than just based on feel or speculation
This does not mean that businesses must have systems, complex analysis, or grab ONE at a high level. Even the first steps, such as synthesis report from Excel file by week, establishment dashboard simple tracking KPI, or analyze the conversion rate customers as well as the expression clarity of thinking, data-driven.
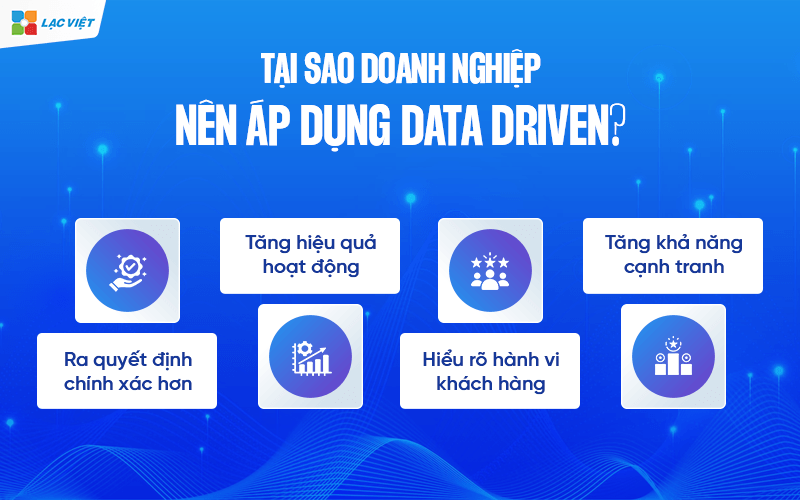
2. Why business need her move towards Data driven?
For a long time, a lot of businesses – especially small and medium enterprises – are accustomed to making decisions based on personal experience or sentiment of the operator. Although this is sometimes effective in the short term, but when the market becomes volatile, customer behavior changes rapidly, competition is increasingly fierce, the decided lack of data support easily lead to serious consequence: the investment in the wrong direction, wasting the budget, slow to react to risks and missed opportunities for development.
Trong bối cảnh đó, việc chuyển đổi sang mô hình ra quyết định dựa trên dữ liệu không còn là xu hướng thời thượng mà là một chiến lược sống còn. Doanh nghiệp ngày nay cần ra quyết định nhanh hơn, chính xác hơn có cơ sở rõ ràng hơn bởi vì chỉ một sai lầm nhỏ về giá, sản lượng hay thị trường cũng có thể khiến toàn bộ kế hoạch kinh doanh bị ảnh hưởng.
The concept of “Data is the new oil” (Data is a precious resource such as oil) is not a saying images. In the background the digital economy, data is the fuel for innovation, the guideline for all decisions and is the foundation for sustainable growth. The leading corporations in the world such as Amazon, Google, Unilever or P&G has data applications not only to operate but also to product design, optimized marketing strategy, creating a personalized experience for each customer.
In Vietnam, many businesses have begun transformation journey: from the use dashboard to track sales daily to the app's AI analyzes customer behavior to put out promotions right time. These businesses not only survive the crisis, but also rapid growth thanks to its ability to react flexibly based on data.
In summary, in the era that all behavior can digitize, all interactions are to re-trace data, then the business know how to take advantage of and make decisions based on data, that business will have superior advantages in both operational efficiency and the ability to long-term growth.

3. The level Data driven in the modern enterprise
Converted to model business Data driven is not a leap in a single night, which is the process of development in each level, from basic to advanced. Understanding this level to help businesses identify yourself now, what should prepare to advance further, and invest in the right – place- right time.
Dưới đây là 4 cấp độ chính của Data-driven cho doanh nghiệp
3.1. Level 1: Data Collection – collect structured data
This is the first platform in the construction business Data driven. Instead of to information scattered in many places such as books, email, Excel file individually, the business began to collect data storage system in a format easy to access, easy to classify, ready to use when needed.
For example: A distribution company consumer goods small scale used to record orders manually, save Excel file individually for each customer, data about the inventory is updated each week. When you start using sales software has a function to store customer information, products and orders in real time, they have transformed from the “has data but do not manage to be” to “system data clear focus.”
Enterprise value received:
- Reduce risk of data loss: When information is stored centrally, businesses no longer worry about lost data due to a broken computer, email, misplaced or the employee.
- Save time synthesis: The accounting department, business or warehouse, no need to “toss” the old file to retrieve the data because the data has been saved available, can export a report at any time.
- Create platforms for the level higher: Want to analyze or forecast accuracy, the prerequisite is that the data must be adequate, clean and organized. This is the first step, but is also a vital element in strategic Data driven.
3.2. Level 2: Data Analytics – analysis report craft
When business has to have source data is organized logically, the next step is to start the analysis of data to understand performance. At this level, data is usually handled by the common tools such as Excel, Google Sheets or accounting software basic.
For example: A business establishment revenue report weekly by filtering sales data by region and product groups. Thanks to that, they realized that the product average price selling than in the middle of the month, or the customer group business purchases with value unit higher than retail customers.
Enterprise value received:
- Detect trends more clearly: Instead of looking at discrete data, the synthesis help to realize consumer model, sales cycle, fluctuations over time.
- Optimal operation sooner: When the product groups that are performing poorly, the business can adjust the price, promotion, or re-allocate resources to improve efficiency.
- Mounting data with a decision: This is the first step to help managers move from “I think” to “the data shows that.” Though still handmade, but thinking data-driven begin to form and spread.
3.3. Level 3: Data Automation – automation predictive analytics
When the enterprise has passed the stage of collecting the analysis crafts, the next step is the application tool technology to automate the process of reporting, data visualizations and start trend forecasting. This is the stage where the data to not only be “seen” that is also the system automatically handles transformed into actionable information in a timely manner.
For example: A manufacturing enterprise use Power BI to build panel (dashboard) track sales, inventory, error rate products day by day. Thanks to the direct connection with warehouse management software – sales, data is updated automatically every hour without personnel report.
When the rate of defective product, an abnormal increase in the week, the system automatically sends alerts to quality management and production director to promptly adjust the chain.
Enterprise value received:
- Save time, reduce dependence on flexible No longer have to wait for the end of the month to see the report, leaders can grasp the situation hour by hour and act immediately if necessary.
- A decision quickly keep abreast of practices: data is continuously updated, the business can adjust the marketing strategy, production or sales within just a meeting.
- Trend forecasting more accurate: When there is data history big enough to be systematized, businesses can anticipate product needs, buying behavior, or condition of inventory coming – from which planned to produce or import more effective.
- Risk reduction in management: automatic alerts (example: the cost exceeds the revenue decline, the unusually high) help managers do not overlook the potential problems.
3.4. Level 4: Data Culture – cultural data at all levels
This is the highest level in the transition to Data driven. At this stage, the data no longer is a tool dedicated for an IT department or finance that become cultural foundation operation of the business. Every level – from employees to management – are using data as a part of the decision-making process every day.
For example, In a business, ecommerce, each parts have the only number private: marketing expense tracking/order logistics tracking the rate of delivery on time, customer care, tracking satisfaction levels. Every week, the parts are present reports based on data and proposed action plan. No decision would be given if no data comes in.
Enterprise value received:
- Increase transparency and personal responsibility: When data is central to every decision has clear base. Staff not being judged based on the calculation that is based on actual results.
- Promote continuous improvement: The room original file is just amount effective to proactively offer suggestions for improvements. Create a feedback loop helps business to operate, flexible to adapt better.
- Support long-term strategy: Businesses can use data to plan 3-5 years, calculate the expected profit, determine the potential market for, or evaluate investment risk.
Create platforms for the automation advanced and AI: When data has seeped into every process, the deployment of solutions such as advanced analytics, AI – machine learning will become more efficient, more valuable.
4. The steps to applying the Data-Driven business
Becoming a business data-driven, not merely as applied technology, which is a process to change from thinking to operate. Below is the model 5 steps to deploy Data driven are many businesses successfully applied, in particular in accordance with Vietnamese enterprises small and medium scale are starting the conversion.
Step 1: build the foundation data collection
This step is laying the foundation. Enterprises need to deploy the system has the capability to collect recorded data in real time, including:
- Software CRM manager (customer relationship) to save interactive history, purchase behavior.
- Software sales, accounting, warehouse management helps to collect transaction data operator.
- IoT devices or sensors if the business activity in the field of production and logistics.
Instead of just know “revenue today is how much”, the business can understand the revenues come from where customers would bring high-value products, which are growth or slowdown, from which to make decisions more accurate.
Step 2: normalize – data storage focus
When there were multiple sources of data, businesses need a unified way storage to avoid data fragmentation, overlap, or lack of consistency. At this time, the construction of a central repository (data warehouse) is very important.
This does not necessarily complex investment. With medium business can start by storage system shared as Google BigQuery, Microsoft SQL Server, or a system database simple but synchronized.
Whole data be “collected about a place to” help the departments no longer controversial because data offset each other. Leader board is also easy access to check data when needed that is not dependent on the technique.
Step 3: application analysis tool
After you have a clean data – focused, business began to use analytical tools, data visualizations to detect trends, unusual points, or potential opportunities.
Some common tools, easy to deploy:
- Power BI (business suit was using Microsoft 365)
- Google Looker Studio (free, user friendly new)
- Tableau (advanced analysis, fit large business)
Managers no longer have to wait for month-end report. All important indicators such as revenue, employee performance, cost marketing... are displayed real-time on the dashboard helps a decision fast more accurate.
Step 4: thinking Training data for team
Technology can be deployed quickly, but thinking data (data mindset) is a core element to help businesses operate according to the model of Data driven real.
Businesses need to organize the basic training for the management team and key employees to:
- Read out the report, analysis of data, basic
- Know how to ask questions based on the data, instead of feeling
- Understand data not own IT department, which is the common property
When each department knows how to use data, suggestions from staff will be persuasive and mental improvement also strong, pervasive in the organization.
Step 5: Set KPI measurement conversion efficiency
A system of Data-driven efficiency need to have a mechanism transparent reviews. Business should build a set of indicators for measuring the effectiveness based on the data, for example:
- The rate of the order on schedule week by week
- Marketing costs / orders
- Conversion rates according to each sales channel
- The processing time of customer complaints
At the same time, can keep track speed access to the dashboard, the number of times data usage in the meeting as a measure of the level of “permeability” of cultural data. Help the business know where we are in the process Data driven parts that would have good practice and where is the stitch that needs improvement.
5. Technology tools to support decisions on data
5.1 Google Analytics: Measuring effective marketing strategy
Google Analytics is a tool for data analysis, robust, widely used to measure and evaluate effective marketing campaign. This tool allows businesses to track user behavior on the website, from which detailed analysis of:
- Traffic sources: Understand the customers come from and where (SEO, advertising, social networking).
- User behavior: Time on page, bounce rate, pages are most visited.
- Conversion: Track the customer journey, from when to visit to time purchase.
Benefits highlights:
- Help optimize marketing campaigns by analyzing real data.
- Make decisions based on trends in customer behavior.
5.2 Tableau: data visualizations
Tableau is the leading tool in the data visualizations, help turn dry numbers khan chart, control panel is easy to understand and lively.
Main features:
- Integrate data from various sources.
- Create charts, graphs, dashboard visually in real-time.
- Supports drag and drop, easy to use even with people who do not specialize in data.
Benefits highlights:
- Increase efficiency analysis thanks to visualize complex data.
- Help leaders rapidly capture information, decision-making.
5.3 Power BI: synthesis and analysis of comprehensive data
Power BI is the tool of Microsoft that is designed to aggregate, analyze data from many different sources, provides a comprehensive overview for business.
Main features:
- Seamless integration with the Microsoft ecosystem (Excel, Azure).
- Support analysis of complex data with features integrated AI.
- Create reports with the ability to customize high.
Benefits highlights:
- Given the detailed analysis, predict business trends.
- Management support performance optimization business.
5.4. AI and Machine Learning
According to a report from PwC (2023), the business use AI to predict trends, growth, ability to gain higher revenue by 21% compared to business do not apply.
Automation big data analytics: AI and Machine Learning played a key role in the processing of big data analytics (Big Data). The algorithm automatically learns from the data help to minimize the analysis time increases the accuracy.
Specific application:
- Analyze customer behavior: AI discovered the template shopping behavior, predict future needs.
- Trend prediction: Machine Learning to predict changes in the market based on historical data.
- Process optimization: AI automation task repeated, time-saving resources.
AI predict business trends, future more accurate: AI doesn't just stop at the analysis, but also help businesses predict the future based on current data. This is especially important in areas such as finance, marketing, supply chain management.
Areas of application:
- Finance: AI predicts stock price fluctuations or credit risks.
- Marketing: AI determine the market trends, optimize advertising campaigns.
- Supply chain: Machine Learning to predict product demand to optimize inventory.
6. Case Studies: successful Business with Data Driven
Amazon: personalized products based on customer data
Amazon uses algorithms Machine Learning to analyze data from the history, shopping, views, reviews of customers. From there, the hint system products that customers are likely to interest most.
Results achieved:
- 35% increase in revenue: The proposed products based on data major contribution to the sales revenue of Amazon.
- Increase customer experience: Personalization products that help retain customers long-term.
Understanding needs – customer behavior through data to help Amazon maintain its leading position in the market of e-commerce.
Netflix: optimizing the user experience by analyzing the data
Netflix uses user data, including history, watch movies, time stop, ratings of customers, to build the proposed algorithm content.
Results achieved:
- The rate of customer retention increased by 25%: Thanks to the proposed film accurately, in accordance with the preferences viewers.
- Effective content higher: Netflix data analytics to decide production movies or series based on the popular hobby of the user.
Typical example: Popular Series House of Cards is produced after Netflix noticed the huge demand from viewers about the kind of politics based on data analysis.
7. Challenges when deploying
7.1. Skills data analysis in the organization
One of the biggest barriers for enterprises to deploy Data Driven is the lack of staff have skills data analysis. Many businesses have difficulty in:
- Understand and harness the data properly.
- Use the analytical tools such as Tableau, Power BI, or Python.
- Interpret data to make business decisions accurately.
Causes:
- Lack of training on data analytics in the organization.
- Employees are often afraid to change or are not yet familiar with the use of new technological tool.
- No data professionals (Data Scientist) or expert data analysis internally.
Solution:
- Internal training: Held in-depth course on data analysis for employees.
- Hire professionals: Recruitment experts analyze data to guide and develop strategic Data Driven.
- Use simple tools: Start by the tool user-friendly as Google Analytics or Power BI before expanding into solution more complex.
7.2. Issues of security, privacy, data
When collecting, data analysis, business faced with problems related to:
- Data leakage: Sensitive data of customers or business from unauthorized access.
- Privacy: Ensure that the collection and use of data in compliance with privacy regulations such as GDPR (Europe), or Decree 13/2023/ND-CP in Vietnam.
Causes:
- Infrastructure security is weak, not enough ability to protect data.
- Lack of understanding of the legal provisions related to data.
- Using the analytical solution does not guarantee safety.
Solution:
- Investing in security: Building systems, data encryption, firewalls to protect data from attacks.
- Ensure compliance with the law: Work with legal professionals to ensure that the process of data processing of the business comply with current regulations.
- Select platform safety: Use tools, data analysis, certified security, such as AWS or Google Cloud.
7.3. The initial investment is high for small and medium enterprises
Challenge: Small and medium enterprises (SMEs) often have difficulty on the budget when starting the deployment. The cost includes:
- Shopping tools analysis software.
- Hiring or training staff.
- Upgrade technology infrastructure for storing, processing big data.
Causes:
- Small scale should limited budget.
- Not clearly see instant benefits from the investment in data.
Solution:
- Start small: Focus on one or two areas of business to deploy before scaling.
- Use cloud solutions: Reduce the cost of infrastructure by using cloud services such as Google Cloud or Azure.
- Find technology partners: Partnered with technology companies to receive support, deploy, and operate.
Data Driven not only is a method that has become one of the deciding factors success in the business environment, competition is fierce today. The application of this method not only helps businesses improve operational efficiency, optimize resources, but also opened up the opportunity to capture the trend, to meet customer needs correctly.