
In the era of digital data, the business can't rely solely on financial statements tradition to take strategic decisions. Financial Dashboard born as an optimal solution to help businesses synthesis, visualization, data analysis, financial an effective way.
Instead of taking hours to handle data on Excel or wait for the report from the accounting department, now the CEO, CFO can track the financial situation in real-time, early detection of risks, forecast financial trends thanks to AI and Business Intelligence (BI).
So, Financial Dashboard what is, why businesses should this tool app and where are the platform Dashboard financial integration best AI today? This article Lac Viet will help you understand more about tools, financial statements, how to improve performance management business finance.
1. Introduction to Financial Dashboard
1.1. Financial Dashboard is what?
Financial Dashboard is a system for reporting financial intuitive help enterprises aggregate, analyze and present financial data in an efficient way. Through the chart, graph, index important financial support managers accurate decisions based on real data.
Dashboard finance plays an important role in supporting business management and effective financial help:
- Process optimization financial statements: Reduce the time of synthesis of data from many different sources.
- Enhance decision-making abilities: Provide overall perspective about the financial situation in real time.
- To limit errors in financial management: Integrated data from the accounting system, ERP, CRM helps ensure accuracy.
- Help business financial forecast: Support trend analysis and financial planning based on historical data.
1.2. The main components of a Financial Dashboard standard
A Financial Dashboard the effect usually include the following components:
- The financial index core (Key Financial Metrics): Include revenue, net profit, profit margin, cash flow, operating costs.
- Data visualizations (Data Visualization): Column chart, line chart, heatmap helps easily track financial trends.
- Integrated multi-source data (Data Integration): Connected with accounting software, management software, financial as AccNet, QuickBooks, SAP.
- Functional analysis advanced financial (Advanced Financial Analytics): Application AI and Machine Learning to give financial forecast.
- Customized according to business needs (Customizable KPI Dashboards): Business can adjust the KPI according to strategic goals.
According to the study of PwC, hơn 80% CFO for that the use dashboard helps to improve financial performance, enhance the accuracy in financial reporting.
1.3. Why business need a Financial Dashboard?
The app Dashboard finance brings many practical benefits for business, especially in the context switch powerful number.
The ability to synthesize financial data quickly
Help enterprises collect, aggregate financial data from various sources such as accounting systems, ERP software, bank statements, management system, warehouse. This helps to significantly reduce the time of synthesis of the data, instead of having to handle reports manually.
Improve strategic decisions thanks to visual reports
Provide overview about the financial situation of the business through the chart visually helps managers easily identify financial trends, identify opportunities or risks. Especially important for the CFO when the need to take strategic decisions about cash flow, investment, cost control.
Optimal processes, financial management, minimize errors
Businesses are often faced with the risk of errors during data entry, processing financial statements. Financial Dashboard helps to automate the synthetic data, the simultaneous detection of anomalies in the data to minimize the risk of accounting errors.
The actual data about the effect of the Financial Dashboard
According to the report of McKinseythe enterprise deployment Dashboard finance can reduce 30% of the time data processingimprove the speed of decision making financial up 40%. In addition, Gartner also pointed out that the organization dashboard app smart can improve the accuracy of financial forecasts up to 95% compared with the traditional methods.
In summary, the use of Financial Dashboard not only to help businesses save time, reduce errors but also enhance competitiveness by bringing financial decisions accurately and more quickly.
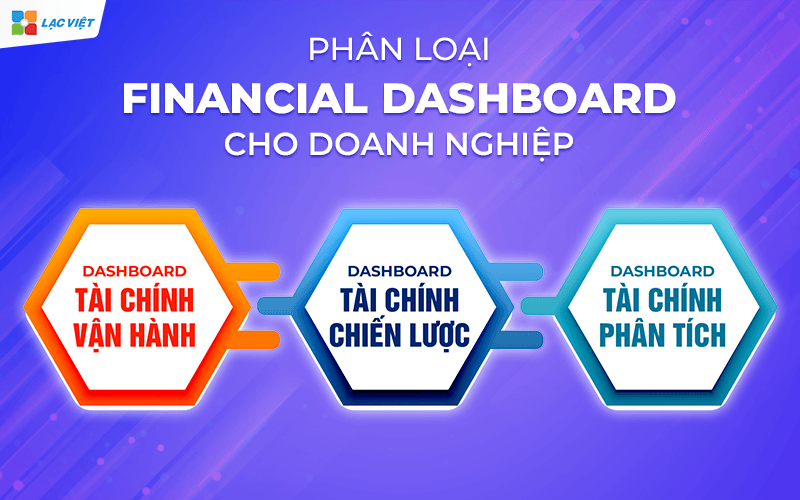
2. Classification Financial Dashboard for business
Based on user objectives, level of complexity, can be classified into three main groups: Operational Financial Dashboard (Dashboard tài chính vận hành), Strategic Financial Dashboard (Dashboard tài chính chiến lược), Analytical Financial Dashboard (Dashboard tài chính phân tích).
2.1. Operational Financial Dashboard (Dashboard finance operate)
Operational Financial Dashboard is a tool to help businesses track the financial indicators in real timesupport the finance department, accounting, sales and operating quickly grasp the business situation.
Features – Benefits
- Keep track of important financial daily: Including revenue, gross profit, cash flow, operating costs, inventory.
- Support line management, short-term moneyTo help businesses monitor cash flow on – going to ensure good liquidity.
- Reduced synthesis time report: Instead of reporting the dashboard provides data in real-time.
- Decision support instant: Allows financial management determine the expenditure unusual, trends, revenue, or warn about excess inventory.
The KPI is important
A number of KPI popular in Operational Financial Dashboard includes:
- Revenue (revenue): Track sales by day, week, month.
- Gross Profit Margin (gross profit margin): Assess the profitability of the business.
- Cash Flow (cash Flow): Monitoring the amount of cash in/out to ensure liquidity.
- Inventory Turnover (inventory turnover): Speed tracking sales and inventory to avoid inventory excessive.
In practical application: The businesses in the fields of commercial, retail, manufacturing, usually use Operational Financial Dashboard to control cash flow, inventory management efficient. For example, a retail company can track speed consumption products according to each day in order to adjust the strategy to enter orders in a timely manner.
2.2. Strategic Financial Dashboard (Dashboard financial strategy)
Strategic Financial Dashboard focus on the decision long-term strategymainly for CEO, CFO and our team of senior leaders. Type this dashboard helps you monitor performance overall financial support, strategic planning and finance.
Features – Benefits
- Support building strategic long-term financialTo help businesses track financial trends, assess business performance through the years.
- Integrate data from multiple sources: Sync data from the accounting system, ERP, software asset management, other financial sources.
- Trend analysis, financial growth: Provides a panoramic view of the growth, profit, investment performance.
- Support risk management financial: Detect early signs of financial instability to adjust timely.
The KPI is important
- Return on Assets (ROA – Rate of return on assets): Reviews effective use of assets.
- Return on Equity (ROE – return Rate on equity): Measure the profits that the business generates from capital invested by shareholders.
- EBITDA (Earnings Before Interest, Taxes, Depreciation, and Amortization – profit before interest, tax and depreciation): Help assess the operational efficiency of the business that is not affected by capital structure.
- Revenue Growth Rate (growth Rate, revenue): Speed tracking revenue growth over time.
In practical application: The company, often large scale use Strategic Financial Dashboard to plan long-term strategy. For example:
- The multi-national corporations use dashboard to track profitable growth by region.
- Business production user dashboard to analyze effective use of fixed assetsreviews investment strategy expanded.
2.3. Analytical Financial Dashboard (Dashboard financial analysis)
Analytical Financial Dashboard is matching tool big data analytics (Big Data), artificial intelligence (AI), modeling financial forecast to help businesses not only to monitor the situation current financial but also forecast future trends, risk assessment,.
Features – Benefits
- Apps, AI and Machine Learning to forecast financial: Detect trends, revenue, fluctuations in cost, risk, liquidity risk.
- Automatically analyze financial data: System can recognize patterns abnormal data, early warning about the financial problems.
- Support reviews effective investment strategy: Provides analysis model, ROI, NPV, IRR to support investment decisions.
- Measure the level of financial risk: Based on market volatility, the performance of the business.
The KPI is important
- Financial Risk Score (index financial risks): Assess the level of risk based on cash flow, liabilities, fluctuations in profit.
- Debt-to-Asset Ratio (the Ratio of debt to assets): To help businesses control the level of loan debt.
- Predictive Cash Flow Analysis (cash flow Forecast): AI trend analysis cash flow in the coming 6-12 months.
- Profitability Trend Analysis (trend analysis, profit): Help business adjust the pricing strategy, the cost to the optimal profit.
In practical application: According to the study of Deloitte, Analytical Financial Dashboard app ONE can reduce errors and financial analysis at under 5%. A number of technology businesses, leading financial has applied this system to:
- Automatically detect financial fraud in the transaction.
- Predict the solvency of the customer based on the trading behavior.
- Assess the financial impact of the business scenario different.
Comparison overview of the types of Financial Dashboard
| Type Dashboard | Object use | Main function | Practical application |
| Operational Financial Dashboard | Accounting and financial management | Track KPI, financial, real-time cash flow management | Managed revenue, gross profit, cash flow, daily |
| Strategic Financial Dashboard | CEOS, CFOS, investors | Support strategic long-term financing, integrating multiple data sources | Analysis, sales growth, ROA, ROE, EBITDA |
| Analytical Financial Dashboard | Financial analyst, senior management | Apps, AI, forecast financial trends, analyze risks | Cash flow forecast, measure the level of financial risks, optimize pricing strategy |
Small businesses can start with Operational Financial Dashboard, doanh nghiệp lớn cần Strategic hoặc Analytical Financial Dashboard để phát triển bền vững, giảm thiểu rủi ro tài chính.
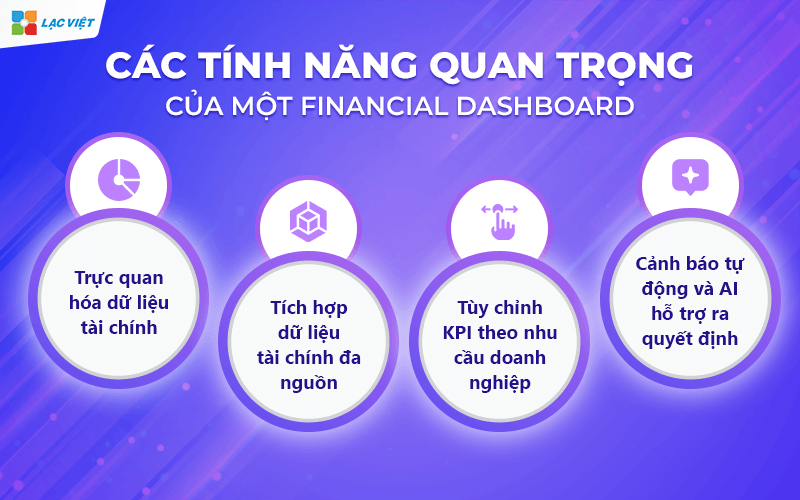
3. The important feature of a Financial Dashboard effectively
Here are the important features help a Financial Dashboard becomes effectively bring practical value to the business.
3.1. Visualizing financial data (Financial Data Visualization)
Financial data are often very complex, including many figures, tables. Presenting data in a visual way will help businesses easily capture the important information without analysis crafts.
Features – Benefits
- The chart dynamic, interactive dashboard: The financial indicators presented in the form of column chart, pie chart, heatmap, gauge chart to easily follow.
- Compare data over time: Display trends change over days, months, years to help businesses assess the financial performance according to each stage.
- Minimize errors due to human: When data is visualization, business will detect the abnormal faster than just using spreadsheets traditional metrics.
Practical application
According to the report of the Harvard Business Review, the use of chart visualization helps to increase the ability to read and understand financial data, up to 70% compared with the raw data. For example, the CFO of a business can see trend chart cash flows to predict the likelihood of liquidity in the next 6 months without need to handle complex data from Excel.
3.2. Integrated financial data and multi-source (Multi-source Data Integration)
A Financial Dashboard efficiency need to have the ability to connect aggregated data from various sources to ensure the accuracy and synchronization.
Features – Benefits
- Kết nối trực tiếp với hệ thống kế toán, ERP: Các nền tảng như AccNet ERP, SAP, Oracle, Microsoft Dynamics giúp đồng bộ dữ liệu tài chính một cách tự động.
- Tích hợp dữ liệu ngân hàng/báo cáo thuế: Dữ liệu giao dịch tài chính từ ngân hàng, hóa đơn điện tử, hệ thống quản lý chi phí được nhập trực tiếp vào dashboard để cập nhật báo cáo tài chính theo thời gian thực.
- Hỗ trợ dữ liệu lớn (Big Data) và API mở rộng: Doanh nghiệp có thể tích hợp dữ liệu từ các nền tảng khác nhau như phần mềm quản lý tài sản, CRM hoặc công cụ phân tích tài chính bên thứ ba.
Practical application
Theo nghiên cứu của McKinsey, doanh nghiệp ứng dụng dashboard có khả năng tổng hợp dữ liệu tài chính nhanh hơn 30% so với doanh nghiệp sử dụng báo cáo tài chính truyền thống giúp doanh nghiệp giảm thời gian lập báo cáo tài chính định kỳ, nâng cao hiệu quả quản lý tài chính.
3.3. Custom KPI according to business needs (Customizable Financial KPIs)
Every business has a financial model is different, so Financial Dashboard should be flexible in setting indicators to measure financial performance tailored to each industry.
Features – Benefits
- Set KPI financial industry:
- Doanh nghiệp sản xuất theo dõi giá vốn hàng bán (COGS), vòng quay hàng tồn kho (Inventory Turnover), tỷ lệ chi phí vận hành (Operating Expense Ratio).
- Doanh nghiệp SaaS tập trung vào MRR (Monthly Recurring Revenue), ARR (Annual Recurring Revenue), CAC (Customer Acquisition Cost), CLV (Customer Lifetime Value).
- Doanh nghiệp thương mại ưu tiên tăng trưởng doanh thu, tỷ lệ hoàn vốn đầu tư (ROI), biên lợi nhuận gộp.
- Khả năng điều chỉnh KPI theo thời gian thực: CFO/CEO có thể điều chỉnh KPI để phù hợp với các mục tiêu chiến lược khác nhau theo từng giai đoạn phát triển của doanh nghiệp.
- Hỗ trợ phân tích hiệu suất theo phòng ban: Dashboard có thể tùy chỉnh để đánh giá hiệu suất tài chính riêng lẻ của từng bộ phận như kế toán, bán hàng, vận hành.
Practical application
Theo báo cáo của Deloitte, 80% doanh nghiệp có Financial Dashboard được tùy chỉnh theo KPI nội bộ đạt hiệu suất tài chính cao hơn 20% so với doanh nghiệp sử dụng báo cáo tài chính tiêu chuẩn. Việc tùy chỉnh KPI giúp doanh nghiệp có cái nhìn chi tiết hơn về hoạt động tài chính, nhanh chóng điều chỉnh chiến lược để tối ưu hóa hiệu suất.
3.4. Automatic alerts, AI decision support
One of the strong points of Financial Dashboard modern is the ability to automatically detect the trend anomalies in financial data, support decision making by artificial intelligence (AI).
Features – Benefits
- Automatic warning of financial risks: When there's large fluctuations in cash flow, the ratio of debt/equity capital or operating cost increases abnormally, the system will automatically send a warning to the CFO.
- Financial forecast based on AI: Artificial intelligence can analyze historical data to predict cash flow in 6-12 months to help businesses active in the financial planning.
- Proposed financial strategy optimal: AI can analyze spending trends, profitability, proposed the scenario financial help businesses achieve higher performance.
Example application AI in financial management
- ONE trend detection of anomalies: If the system sees revenue decrease compared with prediction, WHO will analyze the causes and propose solutions as optimal operating costs or adjust strategy selling price.
- WHO warned liquidity risk: When the ratio of debt to assets (Debt-to-Asset Ratio) exceeds the permissible level, WHO can alert the business to make timely decisions, reduce costs or raise capital.
- WHO support cash flow forecast: A system of AI-powered Financial Dashboard can analyze financial data in 3-5 years nearest to predict the likelihood of future payments, help businesses minimize financial risk.
Practical application
As reported by PwC, more than 65% of enterprises using AI in financial analysis has the ability to detect risk, liquidity risk earlier than 6 months compared with traditional methodshelp business be more active in regulating financial strategy, optimize cash flow.
4. 5 Financial Dashboard financial for business English
Comparison table 6 financial dashboard ai to top
| Tools | AI integration | Salient features detailed | Business suit | The cost |
| Lac Viet Financial AI Agent | SOMEONE financial analysis real-time | – Tự động hóa báo cáo tài chính theo chuẩn IFRS/VAS.
– AI tư vấn tài chính, giúp lãnh đạo doanh nghiệp hiểu rõ “sức khỏe” tài chính. – Dự báo rủi ro tài chính, phân tích xu hướng doanh thu, chi phí, lợi nhuận. – Hỗ trợ truy vấn ngôn ngữ tự nhiên, cung cấp báo cáo theo yêu cầu ngay trong cuộc trò chuyện. – Tích hợp dữ liệu từ phần mềm kế toán, ERP, cập nhật dữ liệu real-time. |
Doanh nghiệp Việt Nam muốn tự động hóa báo cáo tài chính, tiết kiệm chi phí thuê chuyên gia tài chính. | – Gói cơ bản: 500.000 – 1.000.000 VND/tháng.
– Gói nâng cao: Theo quy mô doanh nghiệp. |
| Power BI | Azure AI | – AI-driven Insights, phát hiện bất thường, đề xuất cải thiện tài chính.
– Dự báo dòng tiền, giúp doanh nghiệp quản lý thanh khoản. – Tích hợp trực tiếp với AccNet, SAP, Oracle, Dynamics 365. – Tùy chỉnh KPI theo ngành nghề, hiển thị dữ liệu linh hoạt. – Trực quan hóa dữ liệu mạnh mẽ, báo cáo động, biểu đồ trực tiếp. |
Doanh nghiệp vừa và lớn cần phân tích tài chính chuyên sâu, có hệ sinh thái Microsoft. | – Gói Pro: 9,99 USD/người/tháng.
– Gói Premium: 20 USD/người/tháng hoặc 4.995 USD/tháng cho doanh nghiệp lớn. |
| Tableau | Einstein AI | – Tích hợp AI phân tích tài chính giúp dự báo xu hướng doanh thu, lợi nhuận.
– Trực quan hóa tài chính mạnh mẽ, hỗ trợ phân tích dữ liệu từ nhiều nguồn. – Kết nối tốt với hệ thống tài chính SAP, QuickBooks, Oracle. – Dự báo tài chính thông minh, phát hiện xu hướng rủi ro. – Hỗ trợ truy vấn ngôn ngữ tự nhiên, giúp CFO nhận báo cáo nhanh chóng. |
Doanh nghiệp lớn muốn tích hợp AI vào phân tích tài chính, đặc biệt nếu sử dụng hệ sinh thái Salesforce. | – Tableau Creator: 70 USD/người/tháng.
– Tableau Explorer: 42 USD/người/tháng. – Tableau Viewer: 15 USD/người/tháng. |
| Looker | Google Cloud AI | – AI-powered Predictive Analytics, dự đoán dòng tiền, lợi nhuận dựa trên dữ liệu lịch sử.
– Phát hiện bất thường trong tài chính, cảnh báo chi phí vượt ngân sách. – Tích hợp mạnh với Google Cloud, BigQuery, Google Sheets. – Xử lý dữ liệu tài chính lớn, hỗ trợ truy vấn SQL mạnh mẽ. – Tùy chỉnh KPI tài chính theo từng ngành nghề. |
Doanh nghiệp có khối lượng dữ liệu tài chính lớn, sử dụng hệ sinh thái Google Cloud. | – Chi phí trung bình: 30 – 100 USD/người/tháng.
– Gói doanh nghiệp lớn: từ 5.000 USD trở lên. |
| Sisense | Infusion of AI | – Nhúng phân tích tài chính vào hệ thống ERP, CRM, giúp tích hợp liền mạch.
– AI cảnh báo rủi ro tài chính, theo dõi biến động doanh thu, chi phí. – Phân tích dữ liệu tài chính theo thời gian thực. – Tùy chỉnh KPI linh hoạt, phù hợp với nhiều ngành nghề. – Tích hợp tốt với AccNet, SAP, QuickBooks, Oracle. |
Doanh nghiệp muốn nhúng AI vào hệ thống tài chính hiện tại, giúp tối ưu báo cáo tài chính nội bộ. | – Gói cá nhân: 50 – 100 USD/người/tháng.
– Gói doanh nghiệp: 10.000 – 50.000 USD/năm tùy quy mô. |
4.1. Vietnam Financial AI Agent – automation Solution financial statement with AI
Lạc Việt Financial AI Agent là công cụ phân tích tài chính tích hợp AI đầu tiên tại Việt Nam giúp doanh nghiệp tự động hóa báo cáo tài chính, tối ưu hóa quy trình quản trị tài chính. Hệ thống này cung cấp BI Financial Dashboard đạt chuẩn IFRS giúp kế toán viên/ lãnh đạo doanh nghiệp hiểu rõ “sức khỏe” tài chính của công ty theo thời gian thực.
Không chỉ dừng lại ở việc tổng hợp số liệu, AI của Lạc Việt còn hỗ trợ tư vấn tài chính, phân tích xu hướng, phát hiện rủi ro tài chính, đề xuất giải pháp giúp doanh nghiệp đưa ra quyết định chính xác hơn.
Feature highlights
- Hệ thống báo cáo tài chính chuẩn IFRS/VAS: Bảng cân đối kế toán; Báo cáo dòng tiền; Công nợ phải thu/phải trả; Hàng tồn kho; Doanh thu, lợi nhuận
- AI phân tích tư vấn tài chính thông minh: Dự báo rủi ro tài chính dựa trên dữ liệu lịch sử; Phân tích xu hướng doanh thu, chi phí, lợi nhuận; Đưa ra gợi ý cải thiện hiệu suất tài chính
- Tích hợp dữ liệu real-time từ hệ thống kế toán: Kết nối với phần mềm kế toán, ERP, CRM; Tự động thu thập xử lý dữ liệu tài chính
- Giao diện trực quan, tự động hóa quy trình: Biểu đồ trực quan hóa tài chính; Tự động xuất báo cáo theo yêu cầu; Truy vấn dữ liệu tài chính 24/7 bằng AI
- Bảo mật cao, tuân thủ tiêu chuẩn toàn cầu: Tuân thủ quy định của VAS và IFRs; Tích hợp bảo mật 100% cho dữ liệu tài chính
Advantages
- Tự động hóa hoàn toàn báo cáo tài chính, không cần xử lý thủ công.
- Dữ liệu real-time, giúp doanh nghiệp ra quyết định nhanh chóng.
- Tư vấn tài chính AI, giúp lãnh đạo hiểu rõ tình trạng tài chính mà không cần chuyên gia phân tích.
- Chi phí thấp hơn so với việc thuê chuyên gia tài chính, giúp doanh nghiệp tiết kiệm ngân sách. So với chi phí thuê chuyên gia tài chính (vài chục triệu đồng/tháng), Lạc Việt Financial AI Agent chỉ tốn vài trăm nghìn đến vài triệu đồng/tháng, giúp tiết kiệm đáng kể ngân sách.
- Dễ dàng tích hợp với hệ thống kế toán hiện có, giúp triển khai nhanh chóng.
Cons
- Chưa hỗ trợ ngôn ngữ khác ngoài tiếng Việt.
- Phụ thuộc vào chất lượng dữ liệu lịch sử để AI có thể dự đoán chính xác hơn.
Suitable object
- Doanh nghiệp Việt Nam muốn tự động hóa quy trình báo cáo tài chính.
- Doanh nghiệp có hệ thống kế toán phức tạp cần công cụ tổng hợp dữ liệu nhanh chóng.
- CEO, CFO muốn theo dõi sức khỏe tài chính doanh nghiệp mà không cần chờ báo cáo thủ công.
- Doanh nghiệp vừa và nhỏ muốn tối ưu chi phí thuê nhân sự tài chính.
The cost
- Miễn phí dùng thử với tính năng cơ bản.
- Gói cơ bản: Từ 500.000 – 1.000.000 VND/tháng tùy theo số lượng báo cáo tài chính.
- Gói nâng cao: Tùy theo quy mô doanh nghiệp, tích hợp AI chuyên sâu, báo cáo theo yêu cầu.
4.2. Microsoft Power BI – Solution financial analysis strong AI from Microsoft
Microsoft Power BI is one of the platform software data analysis tài chính, trực quan hóa dữ liệu hàng đầu thế giới, sử dụng AI của Microsoft Azure để giúp doanh nghiệp phân tích tài chính chuyên sâu, dự báo dòng tiền, tối ưu hóa hiệu suất tài chính.
Power BI tích hợp chặt chẽ với Microsoft Excel, AccNet, SAP, Oracle, Dynamics 365, giúp doanh nghiệp dễ dàng thu thập, xử lý và trực quan hóa dữ liệu tài chính theo thời gian thực.
Feature highlights
- Phân tích dữ liệu tài chính chuyên sâu với Azure AI: Phát hiện bất thường trong chi tiêu, doanh thu. Tự động đề xuất giải pháp tối ưu tài chính. AI-driven Insights giúp dự báo xu hướng tài chính.
- Trực quan hóa tài chính mạnh mẽ: Biểu đồ tương tác, báo cáo động, heatmap. So sánh dữ liệu tài chính theo thời gian thực.
- Tích hợp mạnh với hệ sinh thái Microsoft: Kết nối trực tiếp với AccNet, SAP, Oracle, Dynamics 365. Đồng bộ dữ liệu từ Excel, SQL Server, Google Analytics.
- Tùy chỉnh KPI theo ngành nghề: Doanh nghiệp thương mại theo dõi biên lợi nhuận, doanh thu. Doanh nghiệp sản xuất theo dõi COGS, chi phí vận hành. Công ty SaaS theo dõi MRR, ARR, CAC, CLV.
- Hỗ trợ truy vấn ngôn ngữ tự nhiên: CFO có thể đặt câu hỏi trực tiếp, AI sẽ tự động hiển thị báo cáo tài chính.
Advantages
- Khả năng phân tích dữ liệu mạnh mẽ, đặc biệt trong dự báo tài chính.
- Tích hợp tốt với hệ sinh thái Microsoft, giúp đồng bộ dữ liệu dễ dàng.
- Hỗ trợ AI-driven Insights, giúp tự động phát hiện xu hướng tài chính.
- Khả năng mở rộng cao, phù hợp với doanh nghiệp vừa và lớn.
Cons
- Yêu cầu kỹ năng DAX/ Power Query để tạo báo cáo tài chính nâng cao.
- Chi phí bản quyền cao hơn so với các giải pháp khác, không phù hợp với doanh nghiệp nhỏ.
Suitable object
- Doanh nghiệp vừa và lớn muốn tận dụng AI để phân tích tài chính chuyên sâu.
- CFO, CEO, kế toán trưởng muốn có báo cáo tài chính theo thời gian thực.
- Công ty sử dụng hệ sinh thái Microsoft, đặc biệt là các doanh nghiệp đã dùng Dynamics 365.
The cost
- Gói miễn phí: Dành cho cá nhân hoặc doanh nghiệp nhỏ với tính năng hạn chế.
- Gói Pro: 9,99 USD/người/tháng, phù hợp với doanh nghiệp vừa.
- Gói Premium: 20 USD/người/tháng hoặc 4.995 USD/tháng cho doanh nghiệp lớn, có AI mạnh mẽ hơn.
- The cost of implementing the entire system can be higher if businesses need to integrate with SAP, Oracle
4.3. Tableau – Solution financial analysis strong AI from Salesforce
Tableau là một trong những công cụ trực quan hóa dữ liệu tài chính hàng đầu thế giới, được phát triển bởi Salesforce. Công cụ này tích hợp Einstein AI để cung cấp dự báo tài chính, phát hiện xu hướng, tối ưu hóa dòng tiền.
Tableau hỗ trợ doanh nghiệp xây dựng các báo cáo tài chính động, giúp CEO, CFO và kế toán trưởng dễ dàng theo dõi tình hình tài chính theo thời gian thực mà không cần xử lý dữ liệu thủ công.
Feature highlights
- Tích hợp Einstein AI để phân tích tài chính chuyên sâu: Dự đoán xu hướng doanh thu, lợi nhuận, dòng tiền. Phát hiện điểm bất thường trong báo cáo tài chính. Đề xuất các chiến lược tối ưu hóa chi phí.
- Trực quan hóa dữ liệu mạnh mẽ: Biểu đồ động, dashboard tương tác với dữ liệu theo thời gian thực. Hỗ trợ phân tích tài chính theo nhiều chiều dữ liệu khác nhau.
- Kết nối tốt với các hệ thống tài chính và ERP: Tích hợp trực tiếp với SAP, QuickBooks, Oracle, AccNet. Hỗ trợ API mở để đồng bộ dữ liệu từ nhiều nguồn.
- Tùy chỉnh KPI theo đặc thù ngành nghề: Doanh nghiệp thương mại theo dõi tỷ suất lợi nhuận, doanh thu theo khu vực. Doanh nghiệp sản xuất tập trung vào chi phí nguyên vật liệu, tồn kho.
Advantages
- The intuitive interface and user-friendly.
- Financial forecast accuracy thanks to Einstein AI.
- Ability to analyze financial depth with big data.
- Integrates well with Salesforce for business use CRM.
Cons
- Cost of higher Power BI and Looker.
- There is no free version, only trial version.
- Need user training to harness the maximum potential of the system.
Suitable object
- Big business want to app AI in financial analysis.
- Companies are using ecosystem Salesforce want to optimize financial statements.
- The organization has the data volume is large financial need visual culture in-depth.
The cost
- Tableau Creator: 70 USD/người/tháng, dành cho người tạo báo cáo.
- Tableau Explorer: 42 USD/người/tháng, dành cho người phân tích dữ liệu.
- Tableau Viewer: 15 USD/người/tháng, dành cho người chỉ xem báo cáo.
- Chi phí triển khai có thể lên đến vài nghìn USD/tháng đối với doanh nghiệp lớn.
4.4. Looker – tools of financial analysis AI from Google Cloud
Looker là một trong những nền tảng BI (Business Intelligence) mạnh nhất của Google Cloud, giúp doanh nghiệp xây dựng dashboard tài chính hiện đại, tự động phân tích dữ liệu, dự báo tài chính bằng AI.
Looker sử dụng Google Cloud AI để hỗ trợ dự đoán dòng tiền, tối ưu hóa ngân sách và phân tích rủi ro tài chính.
Feature highlights
- AI-powered Predictive Analytics: Dự báo dòng tiền dựa trên dữ liệu lịch sử. Phát hiện các bất thường trong tài chính như chi phí vượt ngân sách. Đưa ra các gợi ý chiến lược tài chính dựa trên dữ liệu.
- Tích hợp chặt chẽ với hệ sinh thái Google Cloud: Kết nối trực tiếp với BigQuery, Google Sheets, Google Analytics. Đồng bộ dữ liệu tài chính từ SAP, Oracle, QuickBooks.
- Xử lý dữ liệu tài chính lớn với SQL mạnh mẽ: Hỗ trợ truy vấn SQL giúp doanh nghiệp phân tích dữ liệu chi tiết. Có khả năng mở rộng quy mô để xử lý dữ liệu tài chính lớn.
Advantages
- Integrated with Google Cloud and BigQuery.
- Financial forecast smart AI.
- Ability to analyze financial data according to multiple viewing angles.
- High data security, powered by Google Cloud.
Cons
- Requires SQL knowledge to optimal use.
- No power of visualization like Tableau.
Suitable object
- Businesses have the volume of financial data using Google Cloud.
- Companies want to integrate AI into financial statements in order to optimize the budget.
The cost
- Average cost of about 30 – 100 USD/person/month depending on the features.
- Cost to deploy depending on the enterprise scale, usually ranging from $ 5,000 and up for big business.
4.5. Sisense – The tools of financial analysis with Embedded Analytics
Sisense là nền tảng BI tài chính tích hợp AI, giúp doanh nghiệp nhúng phân tích tài chính vào ERP, CRM và hệ thống tài chính nội bộ. Công cụ này cho phép các doanh nghiệp tự động hóa phân tích tài chính, đồng thời tích hợp AI để dự báo dòng tiền, quản lý rủi ro.
Feature highlights
- AI-powered Embedded Analytics: Nhúng phân tích tài chính vào các hệ thống doanh nghiệp. Tích hợp AI để phân tích dữ liệu tài chính ngay trong ERP.
- Data Alerts – Cảnh báo tài chính tự động: Hệ thống tự động gửi cảnh báo khi có biến động lớn về doanh thu, chi phí. Hỗ trợ giám sát rủi ro tài chính, dòng tiền.
- Tích hợp mạnh với nhiều hệ thống tài chính: Hỗ trợ kết nối với AccNet, SAP, QuickBooks, Oracle. Đồng bộ dữ liệu tự động từ nhiều nguồn khác nhau.
Advantages
- Embed financial analysis directly into the ERP system, CRM.
- WHO support financial decisions quickly.
- Custom flexible for many industry.
Cons
- Cost of higher Power BI and Tableau.
- Need technical skills in order to customize advanced.
Suitable object
- Doanh nghiệp có hệ thống ERP muốn tích hợp AI vào phân tích tài chính.
- Công ty tài chính, ngân hàng cần tự động hóa phân tích tài chính nội bộ.
The cost
- Chi phí khoảng 50 – 100 USD/người/tháng.
- Gói doanh nghiệp có thể lên đến 10.000 – 50.000 USD/năm tùy theo quy mô.
5. How to deploy Dashboard financial in business
Deployment Financial Dashboard in business, not only help optimize financial management but also enhance performance analysis and decision making. Here are the important steps to build a system for reporting financial performance, in accordance with the needs of each business.
Step 1: Determine needs financial statements of the business
Before deployment, enterprises need to determine target-use dashboard. A number of important questions need to clarify:
- Business should track financial indicators which? (Revenue, profit, cash flow, cost, ROE, ROA...)
- Objects to use dashboard is who? (CFO, CEO, chief accountant, division operation)
- Update frequency data? (In real-time, daily, weekly or monthly)
- The level of detail of the report? (Overview or in-depth into each department)
Clearly identified needs help construction business a dashboard to the point, avoiding excess information or omission of the important indicators.
Step 2: select platform Financial Dashboard fit
Today there are more platforms support visualization of financial data, each tool has strengths. You can rely on the information from section 4 to choose the right tools for the enterprise.
Choosing the right tool depends on the budget, reporting needs, the ability to integrate with the current system of business.
Step 3: connect the data from the accounting system and software business management
Một Financial Dashboard hiệu quả cần tích hợp dữ liệu từ nhiều nguồn để đảm bảo tính chính xác, cập nhật liên tục. Các nguồn dữ liệu phổ biến:
- Phần mềm kế toán: AccNet, SAP, QuickBooks, Oracle Accounting
- Phần mềm ERP: SAP ERP, Odoo, Microsoft Dynamics
- Dữ liệu ngân hàng: Giao dịch tài khoản, khoản vay, dòng tiền vào – ra
- Hệ thống quản lý tài sản: Theo dõi giá trị tài sản cố định, khấu hao
- Dữ liệu bán hàng, quản lý kho: Tích hợp với phần mềm CRM hoặc phần mềm quản lý kho để theo dõi doanh thu và hàng tồn kho
Kết nối dữ liệu tài chính từ nhiều nguồn giúp dashboard cập nhật số liệu tự động, giảm thiểu sai sót trong nhập liệu, tiết kiệm thời gian tổng hợp báo cáo.
Step 4: build – custom interface Dashboard
After the data input, the next step is the ui design dashboard stars for intuitive, easy to use. A number of important principles:
- Arrange the important indicators in central location
- Using graphs instead of tables of data complex
- Choose the color, design, fit to highlight the indicators important financial
- Custom KPIS for each department, user role
For example, the CFO may need to see an overview of corporate finance (EBITDA, cash flow, revenue growth), while the chief accountant need detailed tracking accounts receivable and payable.
Step 5: set up automatic alerts, and dynamic reporting
Một Financial Dashboard hiện đại không chỉ hiển thị số liệu mà còn có thể tự động cảnh báo rủi ro và tạo báo cáo động theo thời gian thực.
- Cảnh báo tự động khi có dấu hiệu bất thường trong tài chính (dòng tiền âm, chi phí vượt ngân sách, tỷ lệ nợ/vốn chủ sở hữu tăng cao)
- Báo cáo động cho phép người dùng lọc, phân tích dữ liệu theo từng tiêu chí (ngành nghề, phòng ban, thời gian)
Theo nghiên cứu của McKinsey, doanh nghiệp áp dụng công nghệ cảnh báo sớm có thể giảm 40% rủi ro tài chính, giúp CFO/CEO chủ động trong việc điều chỉnh chiến lược.
Step 6: Check, adjust optimization
Deploy the dashboard doesn't just stop at the construction of the original system that need to monitor and evaluate the effectiveness, adjusted to match actual business.
- Thu thập phản hồi từ người sử dụng để điều chỉnh giao diện, tính năng
- Tối ưu hóa hiệu suất để dashboard hoạt động mượt mà, không bị chậm khi xử lý dữ liệu lớn
- Bổ sung chức năng nâng cao như dự báo tài chính bằng AI, phân tích xu hướng thị trường
Financial Dashboard not only is a reporting tool that is also help help business management financial intelligence more effectively. Thanks to the integrated AI, real-time data, the system dashboard, modern, such as Vietnam Financial AI Agent, Power BI, Tableau, Looker, Sisense, Domo has helped businesses enhance their ability to forecast, optimize budget and improve financial performance.


![[ĐẦY ĐỦ] Mẫu báo cáo tài chính, tình hình tài chính file excel theo Thông tư 200 và 133](https://lacviet.vn/wp-content/uploads/2025/04/mau-bao-cao-tai-chinh.png)

![[Trọn bộ] File Excel mẫu báo cáo chi phí sản xuất kèm hướng dẫn lập chi tiết](https://lacviet.vn/wp-content/uploads/2025/02/bao-cao-chi-phi-san-xuat.png)