In the context of market volatility, non-stop, the data is gradually becoming a kind of “strategic assets” of any business, regardless of size or field of activity. From sales data, customer behavior to performance internal – all of which leave traces in the form of data. However, what makes the difference lies not in the business of collecting is how much data which is located in analyzing exploitation data to make business decisions at the right time – in the right direction.
As practice shows, many Vietnamese enterprises have now started to invest in the management software, CRM system, ERP for storage management, data tracking, but are having difficulty in the transformation of data into valuable information. Cause the core to come from the lack of skills data analysis all the way in the hr team. They may have data, there is a report, but do not understand the meaning behind the numbers, or do not know how to interpret the data connection with the business goal specific.
This article Lac Viet will help you:
- Understand the skills, analyze data, what is the way simple, easy to visualize
- Recognise the role of practical value of this skill in business
- More important is to know how to develop skills in data analysis, in accordance with the capacity and strategy of your organization
1. Skills data analysis, what is? Why business need care?
1.1 Skills analysis what is data?
Skills data analysis is the ability to collect, process, reading comprehension, interpreting data in order to serve the decision. In other words, this is the ability to turn numbers into useful information from that put forth the specific action.
This is not merely a technical skill. Practical, analytical skills is total harmony between logical thinking, the ability to ask questions right skills, use tools, and the ability to convey ideas, from data to business language.
For example: A sales staff have the skills, analyze data not only recorded revenues months ago, but also know comparison with the same period a year ago, collated with the target plan, analyze the causes increase or decrease so that the proposed strategy of care group more potential customers in the coming months.
The important point is: any location in the business – from accounting, hr, to marketing – also can and should develop this skill.
1.2 why skills data analysis is increasingly important to business?
In the environment of modern business, every decision delay, emotional or without base all carry big risks. Ownership team have skills in data analysis help businesses:
A decision fast having more facility: do Not depend on the conjecture that is based on facts.
Reduce business risk: early detection of problems in the supply chain, financial, or market in order to timely adjust.
Increase work efficiency in each department:
- Finance can budget more accurately
- Hr demand forecast hiring seasonal
- Marketing analysis effective each campaign and optimizing costs
- Sales focus right group of customers are likely to buy high
According to the report of Harvard Business Review, 70% of businesses have a team of possessed skills data analysis, basically achieve profitable growth more sustainable than the business also depends on the properties or reports crafts discrete.
In summary, skills, data analysis, not a temporary trend that is the critical foundation for enterprises to adapt, compete in development during the conversion number. The investment in skills development for this team, not just invest in a personal capacity but also is direct investment in capacity decisions renewal of the whole business.
2. The group skills data analysis, business needs grow
Owning skills data analysis is not synonymous with the deep understanding of the technology or programming. Instead, here is a collection of the capacity practical that any personnel – from operators to managers – also need to turn data into tools for decision support. Here are 5 core skills business should equip his team:
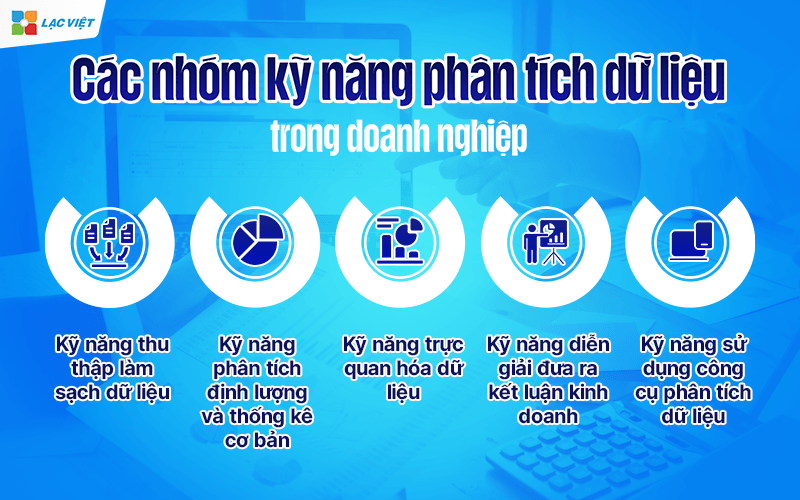
2.1 Skills collecting, cleaning data – the foundation of accurate analysis
Data, though, has the potential to now, will also be worthless if you collected the wrong way or not be cleaned before analysis. This is why skills collect data cleaning is considered the first important step in the entire cycle of data analysis.
Collecting the right data source, right on target
In business, data often exist in many places: accounting system (such as AccNet), software, customer management (CRM), Excel spreadsheet file, Google Sheets, or even via email, contact form, paper. Therefore, personnel should be equipped with skills:
- Identify the right data sources need to take: For example, if you want to analyze the rate of customers repeat purchase, the data source should come from the CRM, not only from the sales reports.
- Ensure consistent updates: Many businesses have the same type of data but scattered in the board room with various storage. Determining where is the “orthodox” is the key element to avoid deviations.
Illustrative example: An employee's aggregate revenue from all branches North and South. If branch A use the date format is “DD/MM/YYYY” longer branch B using “MM/DD/YYYY”, the pooled data without clear structures will lead to serious errors when statistics.
Cleaning data to eliminate risk analysis deviations
“Raw” data often contain many errors: information format, heterogeneous, duplicate data, or misspelled. Skills data cleaning help:
- Remove duplicate data or not valid
- Standardized data format: date, currency code, product...
- Data processing, teen or unusual: given alternative solutions reasonable (for example: complete medium, remove the wrong line)
2.2 Skills quantitative analysis and basic statistics – Reading out data base
After the data has been collected handle, the next step is to analyze the numbers to draw out valuable information. Skills quantitative analysis requires no good at math, but need to understand the tools – basic methods to interpret the data correctly, practices.
Master the calculus basic indicators
User data need to know how to use these simple tools to answer the following questions:
- The average sales per month is how much?
- The rate of growth between this month and last month is how much percent?
- Advertising costs, on average, for each order is how much?
The basic calculations such as:
- The average (mean) helps to understand general trends
- Percentage change in order to compare between the states
- Standard deviation helps to recognize the data are stable or not
All can be made easily with tools like Excel, Google Sheets or accounting software has integrated statistics function.
Compare – contrast – detect abnormalities
Skills don't just stop in the calculation, which still lies in the ability to collate data between the target to find out the relationship or unusual signs.
Practical example: A business e-commerce want to know campaign, which marketing is most effective. By comparison:
- Conversion rate (conversion rate) between Facebook Ads and Google Ads
- Average cost to have a single row (CPA – cost per acquisition)
- Net revenue generated from each channel
Who do the analysis will quickly realize where is the channel should invest, where is the channel need to be adjusted.
When staff in departments can read out the numbers drawn to be information act, businesses will have built a platform operating efficiency active than before market volatility.
2.3 Skills data visualizations – Turn numbers into stories easy to understand
A spreadsheet with hundreds of lines of data will be very difficult to get if not presented clearly. That is why the skills to visualise data (data visualization) is considered the bridge between data and action, particularly during the meeting a decision or when conveying information for the levels are not in-depth data.
Knows how to choose the right chart for each type of data
Not a chart which fits well with any situation. This skill requires the user to know:
- Column chart to compare data between the categories, for example: sales by individual products or region.
- The line chart to track trends over time, such as the number of orders each week, or quarter.
- The pie chart to show the proportion of, for example, the cost structure according to each department.
- Chart combined to display multiple metrics at the same time, such as revenue and growth rates in a chart.
Choosing the right type of chart help the viewer understand the message only after a few seconds, instead of having to read each number discrete.
Use user-friendly tool to present data effectively
The common tools such as:
Excel advanced: Still is a familiar choice of convenience in many businesses, allowing you to create tables, charts, pivot table and use the analysis functions basic. In accordance with the internal report, small groups, or data is not too complex.
Google Looker Studio: Is the solution online, free help visualise the data from Google Sheets, Google Ads, Analytics... with the ability to share reports flexibility to customize easily. Very suitable for business has operated on the Google platform Workspace.
Power BI: Is a powerful tool to build dashboard analysis presents data from various sources such as accounting software, CRM systems, Excel, or SQL database.
LV Financial AI Agent: This is the foundation of financial analysis, smart apps, artificial intelligence, exclusively designed for enterprises, not only supports visualization of financial data with charts and dashboard intensive, but also hints the local project financial regulator specific business goals. LV Financial AI Agent featured with:
- Automatically aggregated financial reports from accounting software like AccNet.
- Visualization indicators such as ROA, ROE, debt, gross profit... in chart form easy to understand.
- Given the proposed financial action based on data – help leaders not only “seeing” but also know “what to do next”.
This tool not only supports graph, but also help build dashboard overview – where managers can track the major indices (KPI) on a single screen.
2.4 Skill interpret the given conclusion business – Turning data into action
A data analysis is only really valuable when the reader understand the core message and what action to do next. This is a skill that requires the combination of critical thinking, understanding of business context, the ability to convey clear.
Know asking the right questions before analysis
Before embarking on data processing, the analysis need to ask:
- “The goal of this analysis is what?”
- “I need to answer anything specific to decision support?”
- “Who will read the analysis results, and they need to know what?”
For example, If the current revenue decrease, instead of just newspaper “reduced 15% compared with the previous month,” the analysis need to find out the cause – is due to reduction in new orders, increase the rate of complete unit or by the average value per order lower?
Interpretation of data towards having goals – solution
Data should be placed in the context of specific business. Who has the skill will:
- Draw conclusions grounded: “advertising Costs increased by 20% but the number of new customers no change ⇒ efficiency are reduced.”
- Propose specific action: “Should revise the advertising content, pause the campaign group no orders for 7 consecutive days.”
Actual value the business receives:
- Avoid the “report to report” – instead, all reports are oriented to action.
- Help leadership decisions quickly, are the base to reduce the risk of bias.
- Increase effective coordination between the analytical department and the department operated by data now have been “speak business language”.
2.5 Skills using tools data analysis – Increase the speed and accuracy in processing information
In the digital era, analytical skills can not lack of support from technology. Instead of processing craft, the app analysis tool that will help businesses save time, improve accuracy and expand the ability to analyze data at a larger scale.
Popular tool easy to apply
- Excel advanced: still is the tool most familiar, allows the use of functions, pivot table, chart, data filter smart.
- Google Looker Studio: connect directly with data online (Google Sheets, Ads, Analytics), create visual reports to share.
- Power BI: support connect multi-source (Excel, accounting system, SQL database...), intuitive, powerful and analyzed in real-time.
In-depth solutions such as LV Financial AI Agent
LV Financial AI Agent is one of the prominent background in the application of artificial intelligence in financial analysis for business in Vietnam. The special point is:
- Automatically aggregated accounting data and presentation of the financial statements complete
- Calculation of indicators of financial depth, such as ROA, ROE, gross profit margin, inventory turnover, debt on the property
- Hint financial action: as adjustment of the budget, reduce debt ratio, or warning when the profit rate is lower than the industry average
3. Business should build skills data analysis for ai?
One of the popular notion, but wrong in many businesses today is that skills data analysis is only for professional analysis or IT department. In fact, to maximize the value of data in the organization, this skill should be widely distributed to the different parts, from the operator to the level of strategic management. Each role will need the skill levels vary, but are directed to a common goal: making decisions based on data instead of hunches.
3.1 operator – accounting – sales – marketing
At the level of staff skills, data analysis, help them understand more about job performance individuals and groups, and actively proposed the project improvement instead of just follow direction from the top down.
- Operators need to capture the data on the progress of work, inventory, error rate or other performance indicator (KPI). From there, they can detect bottlenecks in the process, the proposed scheme optimized resources.
- Accounting staff not only to enter data, report that longer need reading comprehension skills financial data, identify trends, costs or volatility in revenue according to each service for the budget planning more accurate.
- Sales staff can use customer data to identify groups of potential customers, and track the cycle of shopping, evaluate the effectiveness of each program promotion to adjust strategy accordingly approached.
- Marketing staff need the ability to track, analyze campaign data (number of views, approaches, conversion rate, cost per potential customer) to not only optimize the performance of communication but also react quickly before the market volatility.
Reasoning skills data analysis, not just for experts: Because in fact, people directly create or use data every day is line staff. They understand the context of business, understand the customer, understand the process. If equipped skills fundamental analysis, they will:
- Faster decisions, rather
- Increase work efficiency, personal
- Reduce dependence on superiors in the decision the small but important
3.2 Level management decisions
At the management level skills data analysis does not stop at reading the report. The management need to look at the data level, strategy, understand the relationship between the indicators and their impact on the goal of the entire business.
- Head or middle managers need to analyze the performance of the department, compare KPI between the hr team, assessing the cost – benefits of each activity from which to allocate resources appropriately to improve team efficiency.
- Leaders (Chief financial officer, executive, marketing...) need skill synthesis to interpret the data at the macro level. Instead of a decision according to personal experience, they need to review financial trends, market behavior, operational risk under the form of quantitative data to shape long-term strategy.
Benefits for managers when proficient skills data analysis:
- Improve the quality of decision management: People-oriented hr, finance or product are clear base.
- Detect opportunities/risks sooner: Data timely alerts abnormalities in operation or customer behavior.
- Increase capacity operating by numbers material: managers do not need to wait for reports from other departments that can actively retrieve read and understand important information right at the time of need.
For example: A ceo see operating costs increased by 12% in the latest quarter. Instead of just a cut, they use data to analyze specific: the cost increase comes from, where the shipping, or rent out – from that given the local project re-structure more efficient.
4. How to develop skills in data analytics in business
Owning our staff have the skills data analysis, not a natural formation, which need no strategy training and clear application in accordance with the capacity and goals of each business. Here are three direction the fact that the business can start right from internal current, without investing too big into technology or outside expert.
4.1 Organization, internal training, short-term, according to each department
One of the most effective methods to build skills in data analysis is the training focused on the practical work of each department, instead of implementing the general course general.
- Customized training content by role: Staff accountant will need to learn how to analyze expense reports, cash flow; while the marketing staff need to know how to read campaign data and performance media.
- Focus on practice over theory: Instead of explaining abstract concepts, businesses should use data truth of himself to illustrate – for example, revenue months ago, campaign performance, the rate of order cancellation.
- Form of flexibility training: the Enterprise can organize workshop internally by month, invited expert short-term training or combined training online – offline by each functional group.
Business benefits received:
- Built up forces personnel “understand the data, understand reality,” proactive decisions instead of waiting for instructions.
- Cost savings compared to hiring out completely or training under the program do not match.
- Help cultural data spread from level staff to manage the natural way, tied to the day's work.
4.2 Use the tool, simple, user-friendly to support analysis
Many businesses are afraid to deploy data analysis that need to complex systems and human resources, high technology. However, the key to success lies not in advanced technology, which in choosing the right tool – sufficient, accessible and fit with the existing team.
- Excel advanced Google Sheets: This is the popular tool easy to deploy and virtually any staff member who has also accustomed to use. Businesses just need more instructions how to filter data, use statistical functions, graph visualization is already possible to start.
- Power BI, Google Looker Studio: Suitable for businesses wishing to synthesize data from many different sources, like showing information via the dashboard intuitively easy to understand for the leader board.
- LV Financial AI Agent: Is a specialized tool to help analyze financial data is the optimal design for Vietnamese enterprises. Advantages of this tool is the ability to automatically aggregate reports, analysis of financial indicators as important as ROE, ROA, gross profit, give hints, action-based financial management objective. Vietnamese interface, simple operation, does not require technology platform depth is big plus point with the small and medium enterprises.
Enterprise value received:
- To reduce the burden of learning technology, to help employees be more confident when getting started with data analysis.
- Shorten the time to report increased ability to make decisions in real time.
- Improve transparency and uniformity between departments through the same system analysis.
4.3 Integrated analytical skills in the decision-making process every day
One common mistake is training done, analytical skills, but do not take into workflows specific cause staff to gradually forget the skills learned or don't know to apply in.
- Bringing data analysis into the periodic meeting: For example, instead of “oral report” or share a feeling, every parts have to present results based on specific indicators, there are dashboard illustration.
- Applied in the approval process – planning – performance evaluation: The decision of budget expenditures, additional personnel or deploy the new project need to have data analysis comes, expressed in the form data, clear logic.
- Building a culture of making decisions based on data (data-driven culture): The head should set the example by asking about “data” prior to the adoption of a proposal, encouraging the questioning reviewer based on data.
Actual value:
- Increase the objectivity and transparency in the executive.
- Help the leader board is not too dependent on periodic reports from subordinates.
- Create a work environment science, where every individual understand that data is not just tracking tool, which is fundamental to create value.
In the context of business is facing renewed pressure, fierce competition and demand quick decisions more than ever, analytical skills, data is no longer an advantage options – which have become core competencies should be built at all levels in the organization.
Developing skills data analysis does not require businesses to have a team of IT intensive or technology system complexity. Complete business can start from the simple steps: internal training according to the actual demand, application analysis tools as user-friendly as Excel, Power BI or the platform as smart as LV Financial AI Agent, and the most important is to integrate the use of data in the decision-making process every day.


![[ĐẦY ĐỦ] Mẫu báo cáo tài chính, tình hình tài chính file excel theo Thông tư 200 và 133](https://lacviet.vn/wp-content/uploads/2025/04/mau-bao-cao-tai-chinh.png)

![[Trọn bộ] File Excel mẫu báo cáo chi phí sản xuất kèm hướng dẫn lập chi tiết](https://lacviet.vn/wp-content/uploads/2025/02/bao-cao-chi-phi-san-xuat.png)