
In the context of business increasingly competitive, businesses need not only to achieve a high turnover, but also to manage costs effectively and ensure sustainable profitability. Report results of business activities is one of the financial statements, most important, provide a comprehensive view of the performance of the business in a given time period.
Analysis report results of business activities giúp doanh nghiệp đánh giá hiệu suất tài chính, xác định các yếu tố ảnh hưởng đến doanh thu và chi phí và hỗ trợ ra quyết định chiến lược để tối ưu lợi nhuận, tăng trưởng bền vững.
The same Lac Viet track details the information related about analyzing this report, in the article today.
1. Reporting the results of operations what is business?
Report results of business activities (Income Statement or Profit & Loss Statement) is a financial document reflects the revenue, cost and profit of the business in a given time period (month, quarter, year).
Report results of business activities is one of the financial statements the most important help businesses measure the effectiveness activities during an accounting period. The analysis of this report is to help businesses understand the financial situation, support the decision-making strategy to optimize revenue, cost management, and profit growth.
This report helps businesses answer the important question:
- The revenue growth or not?
- Operating costs are reasonable or not?
- Profit gain is how much in comparison with the previous period?
Nói cách khác, phân tích báo cáo kết quả kinh doanh giúp doanh nghiệp đánh giá được hiệu suất tài chính, tối ưu dòng tiền và đưa ra quyết định chiến lược để phát triển bền vững.
2. Phân tích báo cáo kết quả hoạt động kinh doanh đem lại điều gì?
2.1 assess the financial performance of business
The analysis reports the results of operations, business help business:
- Determine the level of efficiency of business operations.
- Track financial trends in order to detect problems before becoming a big risk.
- Evaluate the profitability of products/services and adjust business strategy.
For example: A company e-commerce can analyze the gross profit of each product line to determine which products should be promoted marketing or need to adjust the sale price.
2.2 Identify trends, profitability, revenue, and cost
Analysis of the data over time to help businesses capture the trend in particular:
- Revenue growth by quarter/year to measure growth.
- Costs have increased faster than revenue not? If there are businesses that need to control costs more effectively.
- Net profit can be maintained stable? If reduced, businesses need to investigate the causes, adjust strategy.
For example, If revenue increases, but the cost of advertising increases too quickly, the business may need to optimize marketing effectiveness rather than increase spending.
2.3 Support strategic decisions based on data
A report on the results of business activities is analyzed properly, can help businesses make strategic decisions:
- There should expand the business or not?
- May need to adjust the pricing strategy or not?
- There should invest more in products/services are bringing high profits?
For example, If a software company noticed the array registration service subscribers have the profit rate is higher than the retail software license, they can focus on developing more service packs periodically.
3. Hướng dẫn phân tích các chỉ số trong báo cáo kết quả hoạt động kinh doanh
Here are four important indicator that businesses need to track when analysis report results of business activities.

3.1. Chỉ số doanh thu
Revenue is a core element reflects the efficiency of business. The monitoring and analysis of the revenue metrics to help determine growth rate effective sales strategy and forecast the potential development.
Net revenue and total revenue
- Total revenue (Gross Revenue): Is the total revenue from business activities, before subtracting any deduction whatsoever.
- Net revenue (Net Revenue): Is equal to the total revenue minus the account trade discounts, discounts, sales and every bounce.
The analysis of net sales to help businesses accurately assess the ability to create real revenue after removing confounding factors.
For example, A retail business, had a total revenue of 10 billion, but after deducting the discount and repaid, net revenue only 9 billion. This may signal business need better control over the program, discount or return policies.
Speed revenue growth (Revenue Growth Rate)
Formula:
Speed revenue growth (%) = [(revenue this – revenue previous period) / revenue previous period] × 100
Chỉ số này giúp doanh nghiệp đánh giá khả năng mở rộng thị trường và mức độ thành công của các chiến lược kinh doanh. Nếu tốc độ tăng trưởng doanh thu giảm dần qua các kỳ, doanh nghiệp cần xác định nguyên nhân như thay đổi nhu cầu thị trường, chiến lược tiếp thị chưa hiệu quả hoặc sự cạnh tranh gay gắt từ đối thủ.
3.2. Chỉ số lợi nhuận
Profit is a measure important to reflect the business performance of the business. The analysis of the profitability indicators help to assess the profitability and performance management cost.
Gross profit and net profit
- Gross profit (Gross Profit) Is the difference between net sales and cost of goods sold (COGS).
- Net profit (Net Profit): Is the profit after deducting all operating expenses, financial expenses and income tax business.
If gross profit, but net profit is low, businesses need to consider the expenses of operation or financial costs are accounted too high or not.
Gross profit margin and net profit
Gross profit margin (Gross Profit Margin) = (gross profit / net Sales) × 100
This index helps to measure the ability to control the price of goods sold and make a profit from production activity or service provider.
Bien net profit (Net Profit Margin) = (net profit / net Sales) × 100
Reflects the profitability of the business after deducting the entire cost.
For example, A technology company has gross profit margin of 60% but net profit is only 10%, this may be due to the cost of research and product development (R&D) or marketing costs high.
3.3. Chỉ số chi phí
Costs can directly affect the profitability of the business. The monitor and control the cost index to help businesses optimize operational efficiency.
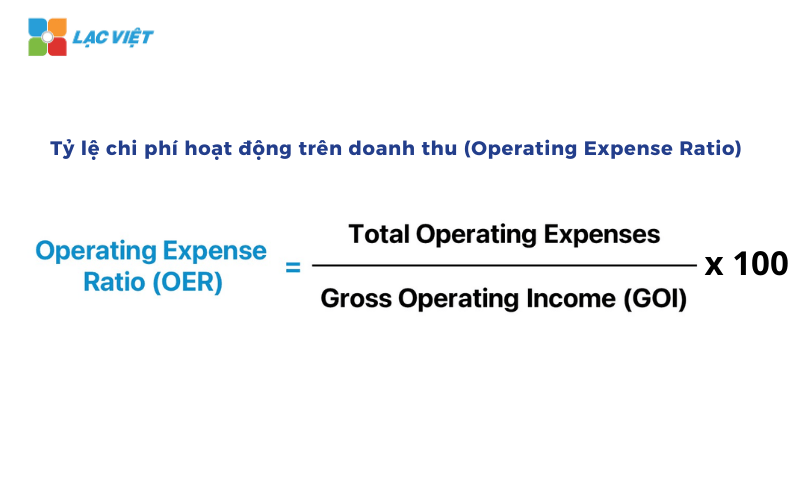
The proportion of operational costs on sales (Operating Expense Ratio)
Formula: Rate operation cost = (Total operating costs / net Sales) × 100
If this ratio is too high, the business may be inefficient spending and the need to optimize cost management.
For example, A company, ecommerce proportion of operational costs by 40% compared to revenue, business needs analysis view the cost of which can be cut without affecting business operations.
Analysis of fixed costs and variable costs
- Fixed cost: includes office rent, staff salaries, the cost of software.
- Variable costs: Include raw materials, shipping costs, sales discount.
For example: A manufacturing enterprises need to optimize the cost of input materials, by negotiating with suppliers or optimize the production process.
3.4. Chỉ số hiệu suất tài chính
Performance indicators financial help to assess the level of efficiency in the use of assets and capital of the business.
Asset turnover (Asset Turnover Ratio)
Formula: asset turnover = net Sales / Total assets average
This index reflects performance in using assets to generate revenue. If this ratio is low, the business can now use the property yet effective.
For example, A logistic company has asset turnover low, possibly due to the amount of media has not been optimized or have too much inventory.
Efficient use of capital (Return on Assets – ROA)
Formula: ROA = (net profit / Total assets) × 100
This index helps to measure profitability on total assets the business owns.
For example: A real estate company has ROA low, possibly due to cash flow is locked in long-term assets and not bring in immediate profit.
Rate of return on equity (Return on Equity – ROE)
Formula: ROE = (net profit / Equity) × 100
This indicator measures the level of profitability of equity, reflecting the ability to create value for shareholders.
For example, A fintech company have high ROE, but ROA is low, can do business using financial leverage to finance business activities.
4. Các phương pháp phân tích báo cáo kết quả kinh doanh công ty
To perform effective analysis, businesses can apply many different methods, from analysis, trend analysis, profit rate to compare with competitors and application of AI technologies.
4.1. Trend analysis (Trend Analysis)
Trend analysis is a method that helps businesses track the change of the financial indicators over time to determine the pattern of growth or decline in business activity.
Track the change of revenues, expenses and profitability over the years
- Revenues have grown steadily every states or not?
- Profits can remain stable, or are in decline due to the increased cost?
- Operational costs are rising faster than revenue, affecting the profit margin not?
For example: A manufacturing enterprise discovered that the revenue growth of 10% per year, but net profit decreased 5%. This may be due to the cost of raw materials or workers to increase faster than revenues, requiring businesses to control costs more closely.
Identify the pattern of growth and decline in business activity
- If revenues tend to increase in peak months (for example: last year, the occasion), the business can adjust the production strategy or extend promotions at the moment.
- If profits fall sharply in a certain period of time, should check to see which factor is the impact (increase in marketing costs, the price of raw material, big discount for customers...).
4.2. Analysis profit margin (Profitability Ratios Analysis)
The rate of profit to help businesses assess the level of profitability of business activity, from which measure the efficient use of capital and assets.
Gross profit margin (Gross Profit Margin)
- Formula: (gross profit / net Sales) × 100
- This indicator says business is holding back how much percent profit after subtracting cost of goods sold (COGS).
- If the rate of gross profit decreased, businesses need to consider cost of goods sold has increased too fast, or if you need to adjust the selling price to maintain the profit margin is not.
For example, A commercial enterprise electronic detection rate of gross profit decreased from 40% down to 30% in two years, the cause may be increased transportation costs due to gasoline prices, or the price competition from rivals.
Net profit margin (Net Profit Margin)
- Formula: (net profit / net Sales) × 100
- This indicator reflects the actual profit business earned after subtracting all expenses, taxes and interest on the loan.
- If net profit margin decreased, businesses need to check cost management, financial costs, and tariffs to find the optimal way.
Rates of return on equity (ROE) and assets (ROA)
- ROE = (net profit / Equity) × 100 → measure the level of profitability of capital contribution from shareholders.
- ROA = (net profit / Total assets) × 100 → assess the level of effective use of assets in business operations.
4.3. Structure analysis of revenue and expenses
Analysis of the structure of revenue and costs to help business understand the source of the main factors affecting the profitability and the degree of reasonableness of the expenses.
Identify the sources of revenue privacy
- Revenue from products/services accounted for the highest?
- Businesses are depending too much on one source of revenue specific't?
- Trend of revenue from each sales channel (online, store, agent) change?
For example, An enterprise SaaS (software format service) discovered that 80% of sales come from customers sign up, premium pack, but the rate of renewal only reach 60%, this will require retention strategies, customer should be improved.
Reviews the volatility of operating costs and impact to profitability
- Personnel costs, marketing, leasing, financing costs are reasonable?
- There are expenses, which increased so fast that does not bring value correspond?
For example, A retail company discovered marketing costs increased by 40%, but revenue increased by only 10%, this may indicate ad campaign is not effective and need to adjust.
4.4. Comparative analysis with competitors
This analysis helps companies to assess the financial position of yourself compared to competitors in the industry.
Comparison rate of profit with the business in the same industry
If the business has low profit margin than the industry average, possibly due to operational costs, high cost of goods sold, non-competitive or performance of poor business.
For example, If a fashion company has gross profit margin of 45% while the industry average is 50%, the company should review the pricing strategy or negotiations with suppliers to reduce the price of capital.
Determine the competitive advantages and weaknesses of financial business
- Business are profitability ratios due to higher pricing strategy better or business model more efficient?
- Competitive advantage of business have come from management, good cost, large-scale production or advanced technology?
5. Hướng dẫn cách đọc phân tích báo cáo kết quả hoạt động kinh doanh chi tiết
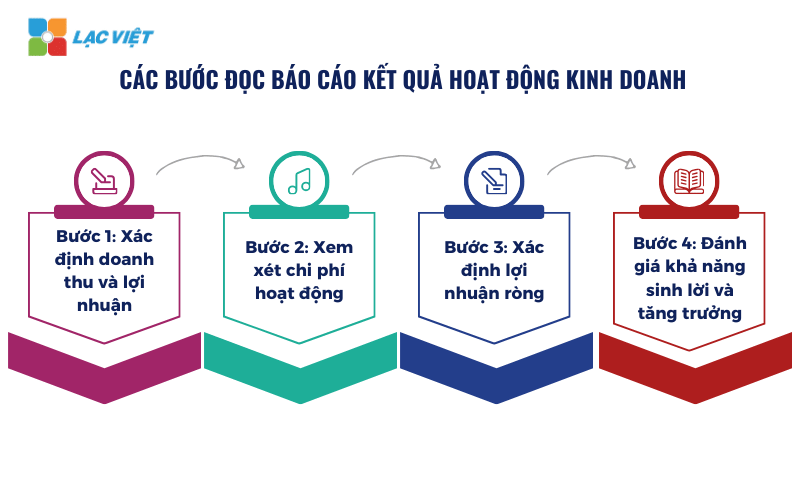
5.1 Các bước đọc báo cáo kết quả hoạt động kinh doanh
Step 1: Determine the revenue and profit
- Check net sales to understand the company is creating how much money from business activities.
- Comparison with cost of goods sold (COGS) to see whether the business can better control the cost of production or not.
- Check out gross profit to assess profitability before expenses are subtracted.
Step 2: consider operational costs
- Cost of sales and business management → If rising faster than revenue, the business may be spending too much.
- Financial expenses → Check if the company is saddled with interest on the loan does.
Step 3: Determine net profit
- Check out pre-tax profit (EBT) to see the performance of practical business.
- Compared to the cost of corporate income tax to see the impact of the tax to profit.
- Finally, the after-tax profit is the most important factors that help to assess the overall effect.
Step 4: evaluate the profitability and growth
- Check out basic earnings per share (EPS) to assess the return on each stock.
- Compared with the previous year to see financial trends of the business.
5.2 Ví dụ đọc báo cáo kết quả hoạt động kinh doanh thực tế
The table REPORTS THE RESULTS of BUSINESS ACTIVITIES (the fourth Quarter and Accumulated, 2014)
Unit: VND
| Indicators | Code | Fourth quarter – Year | Fourth quarter – Years ago | Accumulated – this Year | Accumulated – Years ago |
| Sales and service provider | 01 | 9.493.406.227.102 | 8.343.607.997.241 | 35.703.776.176.355 | 31.586.007.133.625 |
| Deductions | 02 | (158.409.123.814) | (169.575.276.621) | (726.847.843.179) | (637.405.006.769) |
| Net revenue on sales and service provider | 10 | 9.334.997.103.288 | 8.174.032.720.620 | 34.976.928.333.176 | 30.948.602.126.856 |
| Cost of goods sold | 11 | (5.784.904.022.632) | (5.504.672.588.238) | (22.668.451.134.488) | (19.765.793.680.447) |
| Gross profit on sales and service provider | 20 | 3.550.093.080.656 | 2.669.360.132.382 | 12.308.477.198.688 | 11.182.808.446.832 |
| Revenue financing activities | 21 | 132.495.147.774 | 134.326.285.576 | 573.569.553.162 | 507.347.709.516 |
| Financial expenses | 22 | (8.571.208.310) | (17.340.149.689) | (81.697.752.419) | (90.790.817.490) |
| Cost of sales | 24 | (1.436.751.699.576) | (952.807.971.463) | (4.696.142.714.715) | (3.276.431.628.660) |
| Cost management business | 25 | (218.823.368.089) | (162.880.494.685) | (795.568.049.465) | (611.255.680.269) |
| Net profit from business operations | 30 | 2.018.441.952.455 | 1.670.857.802.121 | 7.308.481.218.168 | 7.711.678.203.942 |
| Other income | 31 | 193.261.747.775 | 182.301.804.312 | 367.460.023.857 | 313.457.899.019 |
| Other expenses | 32 | (50.195.086.093) | (28.449.549.756) | (122.819.758.563) | (58.819.862.034) |
| Profit other | 40 | 143.066.661.682 | 153.852.254.556 | 244.640.265.294 | 254.638.036.985 |
| Total accounting profit before tax | 50 | 2.176.921.311.427 | 1.839.575.616.385 | 7.613.368.860.918 | 8.010.256.856.719 |
| The cost of corporate INCOME tax current | 51 | (431.496.798.279) | (336.326.843.783) | (1.580.658.440.379) | (1.483.448.216.660) |
| Costs deferred INCOME tax | 52 | (15.456.443.517) | (33.225.106.669) | 35.492.545.769 | 7.298.675.568 |
| Profit after corporate income tax | 60 | 1.729.968.069.631 | 1.470.023.665.933 | 6.068.202.966.308 | 6.834.107.315.627 |
| Basic earnings per share (EPS) | 70 | 1.730 | 1.470 | 6.068 | 6.533 |
Structure overview of reporting the results of operations business
This report consists of key indicators:
- Profit (loss) in joint venture: profit or loss from the joint venture operation.
- Total accounting profit before tax: the Total profit of the business before taxes corporate income.
- Income tax expense current corporate: The corporate tax payable to The state.
- Cost of corporate income tax deferred: taxes postponed due to the difference between tax policy and accounting.
- Profit after corporate income tax: The actual profit remaining after deducting tax.
- Basic earnings per share (EPS – Earnings Per Share): indicators to measure the level of profitability on each company's stock.
Read report results of business activities
To understand this report, we will go step by indicators and analysis according to the column data.
Analyze revenue and profit
- Total accounting profit before tax (Quarter – Year): 2.176.921.311.427 VND
This figure shows the company has profit before tax of very large, shown effective business operations.
- Income tax expense business current (Quarter – Year): (431.496.798.279) VND
This is amount of taxes that businesses have to close in the states.
- Cost of corporate income tax deferred (Quarter – Year): (15.456.443.517) VND
Tax expense deferred reflect the difference in tax between accounting and tax rules.
- Profit after corporate income tax (Quarter – Year): 1.729.968.069.631 VND
This is the net profit that the company retains after taxes.
Profit allocated to shareholders
- Profit belonging to minority shareholders: 235.729.748 VND
This is a portion of the profits for the shareholder owns a minority stake.
- Profits belong to shareholders of parent company: 1.729.732.339.883 VND
This is the actual profit for the main shareholder of the company.
- Basic earnings per share (EPS): 1.730 VND/stock
EPS is an important indicator reflecting the level of profit which the company generates on each stock is circulating.
Analyze financial trends over the years
Here's a comparison between this year and previous years to identify trends:
| Indicators | The fourth quarter of this Year (VND) | The prior Year fourth quarter (VND) | Accumulated this Year (VND) | Accumulated Years ago (VND) |
| Profit (loss) in joint venture | 15.412.697.290 | 14.865.559.708 | 59.887.377.298 | 43.940.615.792 |
| Accounting profit before tax | 2.176.921.311.427 | 1.839.575.616.385 | 7.613.368.860.918 | 8.010.256.856.719 |
| Tax expense current | (431.496.798.279) | (336.326.843.783) | (1.580.658.440.379) | (1.483.448.216.660) |
| Tax expense deferred | (15.456.443.517) | (33.225.106.669) | 35.492.545.769 | 7.298.675.568 |
| Profit after tax | 1.729.968.069.631 | 1.470.023.665.933 | 6.068.202.966.308 | 6.834.107.315.627 |
| Basic earnings per share (EPS) | 1.730 | 1.470 | 6.068 | 6.533 |
Review financial trends
- Accounting profit before tax this year's sharp increase compared with the previous year (2.176.921.311.427 VND compared with 1.839.575.616.385 VND) → show business operations efficiently.
- Cost of corporate income tax is higher than the previous year, affecting the net profit.
- Profit after tax increased significantly in the fourth Quarter, but accumulated from the beginning of the year decreased slightly compared with the previous year → this may be due to rising costs or other unusual element of the year.
Based on reported results of operations and business of Dairy products joint Stock company in Vietnam, can draw some main points:
- Profit before tax and after tax growth in the fourth Quarter, showed business activity is going well.
- Tax expense increased significantly affect net profit.
- Accumulated from the beginning of the year profit tends to decrease slightly, this should be monitored to control costs, optimize profitability in the coming quarters.
- Basic earnings per share (EPS) increases, this is a positive signal for the shareholders, investors.
6. Lạc Việt Financial AI Agent – Giải pháp AI phân tích tài chính thời gian thực
Lac Viet Financial AI Agent is the solution of financial analysis integrated artificial intelligence (AI), the first in Vietnam to help businesses automate financial statementsdata analysis in real time and giving financial forecast accuracy.
Feature highlights
- Automatically aggregate financial data from the accounting system and ERP to update the report in real time.
- Reporting system auto finance helps businesses save time and resources compared with the method of analysis crafts.
- Trend forecasting revenue, cost and profit, to help leaders plan to finance more accurate.
- Anomaly detection in financial statements, supports control the financial risks.
- Integrated with the system BI Financial Dashboard to visualize financial statements.
Application in the analysis report, the results of operations business
- Automatic analysis, profit margin, revenue, cost to find out the strengths, weakness in business activity.
- Early warning of financial risks, help enterprises take measures for timely adjustment.
- Decision support based on financial forecasts exact from the actual data.
In the era of big data, the integration of technology into analysis report results of business activities is an inevitable trend. Tools such as Power BI, Tableau, Vietnam Financial AI Agent to help businesses automate the reporting process, providing comprehensive perspective about the business situation in real time. To maintain competitive advantage, enterprises need to build a financial strategy based on data and application tools modern analysis, thereby improving the performance and sustainability in the long term.


![[ĐẦY ĐỦ] Mẫu báo cáo tài chính, tình hình tài chính file excel theo Thông tư 200 và 133](https://lacviet.vn/wp-content/uploads/2025/04/mau-bao-cao-tai-chinh.png)


![[Trọn bộ] File Excel mẫu báo cáo chi phí sản xuất kèm hướng dẫn lập chi tiết](https://lacviet.vn/wp-content/uploads/2025/02/bao-cao-chi-phi-san-xuat.png)