

In the business environment and volatile financial data is the critical foundation to help businesses evaluate the performance of operation, control risks and make decisions strategically. However, just considering the numbers on the financial statements is not enough for businesses to capture comprehensive financial situation. This is the time to analyze financial statements become the indispensable tool to help businesses not only look back on business results, but also predict future trends, optimize financial performance.
So how to analysis of financial statements business in an effective way? What methods are commonly applied? And business can take advantage of tools to process optimization, financial analysis? Let's Lac Viet find out details in this article.
Related report:
1. Financial statements what is?
Financial statements is a collection of the consolidated report on the financial situation, business results, cash flows of a business in a given time period (usually quarterly or annually). This is an important document to help businesses, investors, banks with stakeholders assess the financial health, operational efficiency of the business.
Financial statements provide a broad overview on the financial situation, results of operations of the business. The main purposes include:
- Evaluate profitability, business performance: compare revenue, cost and profit in each period to determine the growth trend.
- Determine the solvency level of financial risk: Check business can afford to pay the debt to term or not.
- Support business decisions: Help leaders put out financial strategies investment accordingly.
- Meet legal requirements, tax: Business must establish and submit financial statements under the provisions of the law.
- Provides information for investors/banks: investors rely on financial statements to decide pouring capital, also the bank consider the possibility of repayment of the business before granting credit.
2. Types of financial statements the company's critical needs analysis

2.1 the balance Sheet – Assessment of the situation of assets, liabilities, equity
The balance sheet shown painting the overall financial of the business at a specific time, consisting of three main parts:
- Property: includes short-term assets (cash, receivables, inventory), long-term assets (machinery, real estate, long-term investment).
- Liabilities: bank loans, debts to pay suppliers, the tax payable.
- Equity: capital contributed by shareholders, retained earnings.
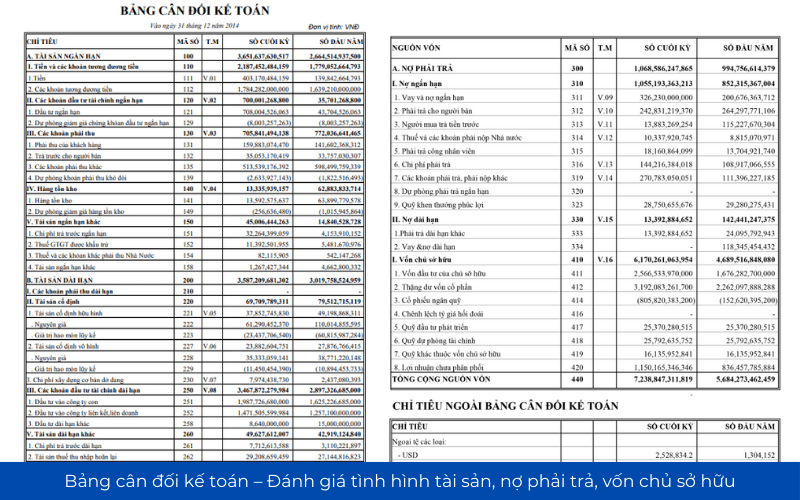
The ratio of debt to total assets (Debt to Total Assets) are important indicators to assess the degree of financial risk. If this ratio is high, businesses are dependent on more debt than equity.
2.2 report business results – analysis of revenue, costs, profits
Report business results reflect the performance of the business during an accounting period, help to assess the ability to generate profits from business operations.
The only important objective needs analysis:
- Net revenue: Total revenue after deduction of discounts discount.
- Gross profit: Reflect production efficiency, business before deducting operating costs.
- Net profit: The net profit after tax, reflecting the profitability reality.
- Net profit margin (Net Profit Margin): the Ratio of net profit on revenue, to help evaluate the effectiveness of business operations.
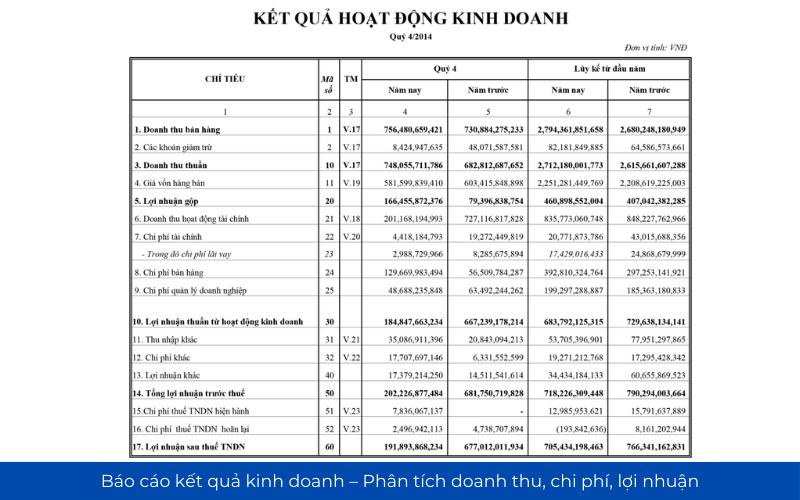
If the business can increase revenue, but profits fell, to consider factors such as cost of production, operating costs are rising or not.
2.3 statements of cash flows – track cash flow in/out, evaluate the possibility of payment
Statements of cash flows for the actual money come into/go out of business, divided into three categories:
- Cash flows from operating activities: Reflection effect to create cash flow from the main activity.
- Cash flows from investing activities: show the account investment, the purchase of fixed assets.
- Cash flows from financing activities: includes loans, debt repayment, dividend.
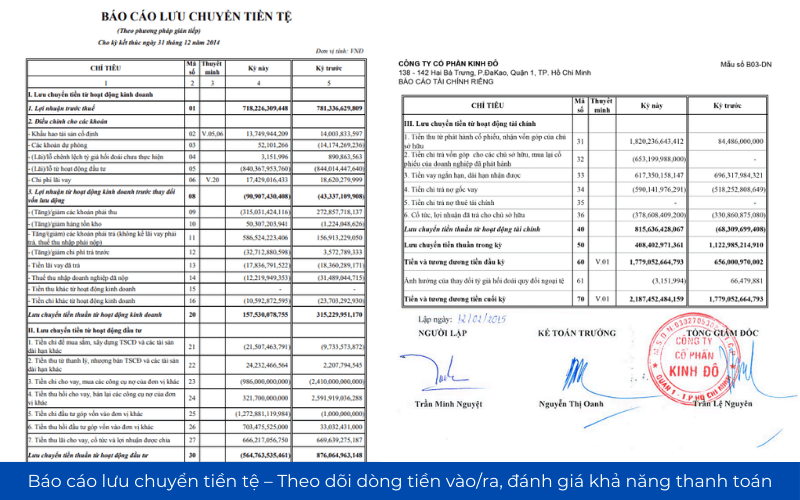
Cash flow business operations, big cock, proven business ability to self-funding for activities that do not depend on the loan.
2.4 notes to financial statements – Provides detailed information about the item financial
Notes to financial statements are an important part in the system of financial reporting of the business, help to explain in detail the financial indicators presented in the balance sheet accounting and reporting business results, statements of cash flows.
Notes to financial statements not only is the additional description, which is also important tools to help investors and businesses together stakeholders to better understand the financial situation of reality.
- Businesses need to ensure transparency, provide detailed information about the item finances to help the process of financial analysis more accurate.
- Investors/financial managers should use notes to financial statements to assess risks, detect trends to make financial decisions accordingly.
- Technology AI and BI helps automate analysis notes to financial statements, improving accuracy, saving time data processing.
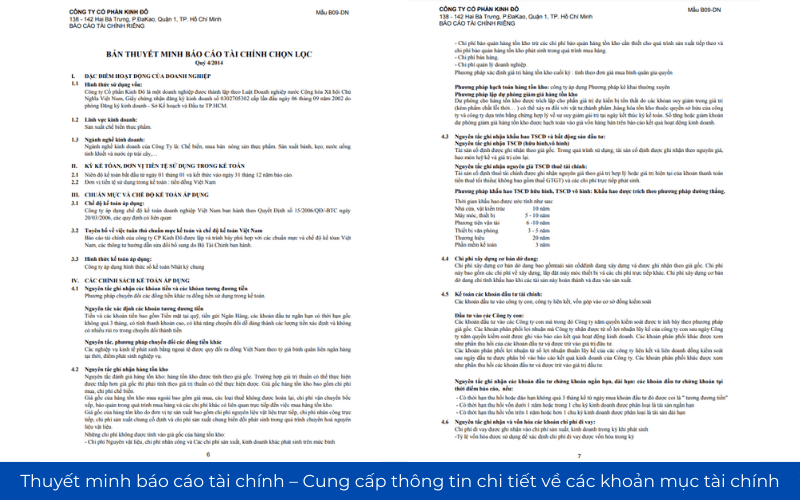
Understanding and exploiting notes to financial statements will help businesses optimize financial strategies, enhance performance, strengthen financial transparency in the market.
3. Analysis of financial statements, what is? Why need to analyze financial statements company?
3.1 analysis of financial statements, what is?
Analysis of financial statements business is the process of collecting, processing and evaluating financial data to measure financial performance for the financial health of the business.
This process uses financial indicators, methods of analysis, tools and support to help businesses assess the profitability, operational efficiency, solvency, the level of risk in business activity.
Analysis of financial statements, the company plays an important role in supporting the decision, financial, investment, risk management helps enterprises:
- Evaluate performance based on financial indicators such as revenue, profit, operating costs.
- Detects potential risks, warning of problems related to cash flow, liquidity, solvency debt.
- Support financial planning, budget efficiency based on real data.
- Improve your ability to raise capital, provide transparency report helps increase trust from investors/banks.
3.2 why should analyze financial statements company?
Support financial decisions based on accurate data
One of the most important goals of the analysis of financial statements in business is to help leaders have clear view of the financial situation, from which making a decision finance.
For example, if a business has net profit margin (Net Profit Margin) dropped for a third consecutive year, the manager should find out the cause from operating costs, cost of goods sold or revenue matters to take measures to adjust timely.
Trend forecasting, financial planning and cash flow efficiency
Analysis of financial statements helps in business:
- Forecast future cash flows, which helps to avoid the shortage of working capital.
- Planning, spending, investment is suitable based on trends, revenues, and expenses.
- Determine the demand for capital mobilization and ensure businesses have enough resources to develop.
For example, a manufacturing business can use cash flow analysis to the past to forecast capital needs in the high season, from which it plans to raise capital or bank loans in a timely manner.
Evaluate performance and detect signs of financial risk
- Businesses can track the gross profit margin, net profit ratio, operating expenses to assess operating efficiency.
- If the ratio of debt to equity (D/E) is too high, businesses risk losing financial balance.
- Trend analysis of financial help detect risks early, to help businesses make timely adjustments in business strategy.
Support raising capital through financial statements transparent clear
Financial reporting helps clear:
- Investors assess the potential growth of the business, decided to pour capital.
- The bank considers the possibility of repayment, the decision to grant credit with interest matching.
- The partner to assess the reliability of the business, the decision to partner long-term.
For example, a business with ROE (Rate of return on equity) remained stable over 15%, operating cash flows will easily convince investors to pour capital than the business has the cash flow and high debt ratio.
4. Guide on how to analyze financial statements business
4.1. Analysis of capital structure and asset structure
Analysis of capital structure and asset structure to help businesses understand how they are funded business operations, asset management, to optimize performance, use of capital. The balance reasonable between capital and assets are important factors to ensure business sustainability performance less financial risk.
4.1.1. Analysis of asset structure
Asset structure reflects the proportion between short-term assets and long-term assets to help assess the degree of financial flexibility of the enterprise.
Short-term assets / Total assets: this index indicates the proportion of assets can be quickly converted into cash to meet demand payment in the short term.
- If the ratio of assets to short-term high (over 60%), businesses are likely to pay well but can are keeping too much cash or inventory, reduce performance, use of capital.
- If the ratio of assets to short-term low (below 40%), business risk, liquidity when there are other financial obligations to term without enough cash to pay.
Long term assets / Total assets: this indicator measures the level of business investment in fixed assets such as plant, equipment, technology.
- If the rate of long-term assets, enterprises may encounter liquidity problems because this property is difficult to convert into cash immediately.
- On the contrary, if the business proportion of long-term assets is too low, there is not enough investment in fixed assets to expand production or long-term business.
Practical example: A manufacturing enterprise has the rate of long-term assets accounted for 70% of total assets may face liquidity risk if the cash flow business is not stable. However, with a trade enterprise, the ratio of assets to short-term high (inventory, public debt) is normal thing because the business cycle of them shorter.
4.1.2. Analysis of capital structure
Sources of capital business consists of two main components: liabilities and equity.
Liabilities / Total capital: this indicator measures the level of businesses use loans to finance business activities.
- If the ratio of debt to pay high (over 60%), the enterprise can meet the financial pressure due to interest cost big. This is especially dangerous if the revenue is not stable.
- If the ratio of debt to pay low (below 40%), the enterprise can is safe operation, but may miss opportunities to expand due to not yet effective leverage loans.
Equity / Total capital: this Ratio reflects the level of funding from the capital's internal business.
- If this ratio is high, business is less dependent on borrowed capital, and have the foundation of financial stability.
- If rates are low, businesses can now rely too much on borrowed funds increases the financial risks if interest expense increase.
Practical example: A technology company, startups can use debt to expand quickly, but if the debt ratio is too high, the revenue does not increase proportionately, it will lead to the risk of insolvency.
How to assess overall
- Business should have a reasonable ratio between short-term assets and long-term assets to ensure solvency, but still have enough fixed assets to grow.
- Debt ratio needs to be balanced to take advantage of financial leverage, but do not increase the risk of losing solvency.
- Structure property/capital should be monitored frequently to adjust the fit with the business situation and market.
4.2. Analysis of solvency
Analysis of solvency help businesses assess the level of readiness in meeting financial obligations, especially the ability to pay the debt due.
4.2.1. Liquidity ratios current
Recipe: liquidity ratios current = short-term Assets / short-term Debt
Meaning:
- If number > 1, the business has enough short-term assets to pay short-term debt, but if too high (above 3), can business is holding too much property do not answer.
- If number
Practical example: A retail business has a number of payments current 1.5 shows they have enough short-term assets to pay the debt, but if this number falls below 1, they need to consider solutions such as debt collection or restructuring working capital.
4.2.2. System of fast payments
Formula: quick ratio = (current Assets – inventory) / current Liabilities
Meaning:
- If the quick ratio > 1, the business can pay debts even when not sell inventory.
- If number
Practical example: A manufacturing company has a current payout, but the system of fast payments, low can, so they have too much inventory. If inventory is not selling quickly, they will encounter problems in the payment of the debt.
4.2.3. System of payment of interest on loans
Formula: coefficient of payment of interest on loan = profit before tax and interest (EBIT) / interest Expense
Meaning:
- If score > 3, the business has enough profit to pay interest on the loan, less financial risk.
- If number
Practical example: A real estate business, there are many loans need to ensure the system of payment of interest on loans is high enough to avoid the risk of losing the ability to pay debts when interest rates rise.
How to assess overall
- Businesses need to maintain liquidity ratios current and quick ratio at a safe level to ensure the ability to pay the debt in the short term.
- Need a monitoring system of payment of interest on loans to ensure that the business does not fall into the state debt is too large leads to loss of ability to pay.
- Combined with cash flow management efficiency in order to maintain financial stability.
4.3. Analysis financial leverage in the financial statements
Financial leverage reflects the level of businesses use loans to finance business activities. Business can take advantage of financial leverage to expand its operations without raising capital owners. If, however, the use of loans, excessive without control is of interest expense businesses can face risks of serious financial.
The important indicator in the analysis of financial leverage
4.3.1 debt (Debt Ratio)
Formula: debt = Total debt / Total assets
Meaning:
- If the debt > 0.5: Business financing more than 50% of assets in debt and shows the level of high dependence on borrowed capital. This can increase the financial pressure, especially when interest rates increase or decrease revenues.
- If the coefficient of debt
4.3.2 the ratio of debt to equity (D/E – Debt to Equity Ratio)
Formula: debt to equity = Liabilities / Equity
Meaning:
- If the multiplier D/E high (above 2.0): Businesses are using too many loans compared to capital increases the financial risks when market volatility.
- If the coefficient of D/E is low (below 1.0): Business has the capital structure safety, but could not make maximum use of borrowed funds to growth.
4.3.3 System of payment of interest on loans (Interest Coverage Ratio – ICR)
Formula: coefficient of payment interest = EBIT / interest Expenses (In that EBIT is profit before tax and interest)
Meaning:
- If this coefficient is > 3, the enterprise has the ability to pay interest on the loan better, less financial risk.
- If this coefficient
How to assess the level of risk finance from financial leverage
- Business has a high debt but steady profits can still be in control risk, especially in the industry have high profits, such as real estate or energy.
- If interest expense increased faster than the speed of profitable growth, the business can fall into a state of insolvency.
- When the ratio of D/E is too high, but the coefficient of payment of interest on loans are low, businesses can face the risk of bankruptcy if no control is the financial cost.
Suppose a manufacturing enterprise of debt is 0.6 and the coefficient of D/E is 2.5, this suggests the business funded assets in loan debt. If interest expense increased due to market interest rates change, the business may have to cut costs or financial restructuring to sustain the activity.
4.4. Analyzing profitability
Profitability reflects the performance of the business in generating profits from sales, property. This is a group of important indicators help to assess the effectiveness of the business model and financial strategy.
4.4.1 gross profit margin (Gross Profit Margin)
Formula: gross profit margin = (gross profit / revenue) × 100%
Meaning:
- Gross profit margin shows businesses better control the cost of production, has the ability to create high value from the revenue.
- If gross profit margin decreased through the years, the enterprise may is facing pressure the price of raw materials or strategic sale price is not reasonable.
4.4.2 Margin net profit (Net Profit Margin)
Formula: profit margin, net = (net profit / revenue) × 100%
Meaning:
- This indicator expresses the percentage of the profit that business earned after deducting all operating expenses, taxes and interest on the loan.
- If the net profit is low, the business might be experiencing problems on cost management or the price structure has not yet optimal.
4.4.3 Rate of return on asset (ROA – Return on Assets)
Formula: ROA = (net profit / Total assets) × 100%
Meaning:
- ROA shows the business using assets efficiently to generate profits.
- If ROA is low, can businesses are investing in too many assets, but is not utilized efficiently.
4.4.4 Rate of return on equity (ROE – Return on Equity)
Formula: ROE = (net profit / Equity) × 100%
Meaning:
- ROE higher business as optimize the profits from equity.
- If ROE subside, businesses can are experiencing performance issues business or to raise additional working capital and diluted profit.
How to evaluate performance profitability of the business
- Comparison with the industry average: If the business has profit margin lower than competitors in the same industry, need to review business strategy.
- Trend analysis: If the profit margin decreased gradually over the period, possibly due to increased costs or revenues decline.
- Combined with financial leverage: A business have high ROE, but the D/E is too large may be relying too much on loans, potential financial risks.
A commercial company has gross profit margin of 20%, the profit margin net 5%, ROA 4% and ROE of 15%. This shows that the company is using assets quite effective to make a profit, but net profit is low, maybe due to the cost of high activity.
4.5. Cash flow analysis
Cash flow analysis to help businesses understand the ability to generate cash, ensure solvency and maintain sustainable operations. A business highly profitable but cash flow weak, may have difficulty in liquidity, which leads to the risk of losing the ability to pay the debt or not enough capital to expand the business activities.
4.5.1. Analysis of cash flow from operating activities (Operating Cash Flow – OCF)
Cash flow from operating activities reflects the amount of cash that the business generates or used from the main business activities. This is the cash flow the most important because it shows the business can actually create money from the sale of products, services or not.
Formula for calculating cash flow business activities
Cash flow business activities = Cash receipts from customers – Cash paid to suppliers – Cost operation
How to evaluate cash flow business activities
- Cash flow activities ocean (OCF > 0): shows good business performance and ability to pay high. Businesses can self-financing for activities that do not need a loan.
- Cash flow operation pussy (OCF
4.5.2. Analyzing cash flow from investing activities (Investing Cash Flow – ICF)
Cash flow from investing activities reflect the funds that businesses use to purchase assets, long-term or earned from the sale of the property.
Formula for calculating cash flow investment
Cash flow investment = proceeds from sale of assets – Cash paid for purchase of fixed assets – investments in other businesses
How to evaluate cash flow investment
- ICF pussy (ICF
- ICF ocean (ICF > 0): Businesses can now sell the property or withdrawal of capital from investments. If this takes place continuously, the business might be experiencing financial difficulties and had to sell assets to maintain operations.
4.5.3. Analyze cash flow from financial activities (Financing Cash Flow – FCF)
Cash flow from financing activities reflects the business, raise capital from external (debt, issuing shares), or use the money to pay off debt, dividends.
Formula for calculating cash flow finance
Cash flow financing = Cash receipts from issuance of stock + Cash loan – Cash dividend – Money paid loan debt
How to evaluate cash flow finance
- FCF positive (FCF > 0): Business is raising capital through the issuance of shares, debt or external funding. If the business constantly have the cash flow finance cock, but the cash flow works, maybe they are taking on debt to cover losses.
- FCF pussy (FCF
How to assess overall business cash flow: Enterprises need to consider the combination of the three cash flow to put out accurate assessment:
Case good:
- OCF, big cock, ICF negative FCF pussy → Business is expanding production by profits from business operations.
- OCF, big cock, ICF negative FCF, big cock → Business are investing to expand and raise capital successfully.
Cases should be noted:
- OCF pussy, ICF negative FCF, big cock → Business may borrow to maintain operations, potential financial risks.
- OCF, big cock, ICF ocean, FCF, pussy → Business is selling the property but still repayment, there may be signs of shrinking business.
5. The method of analysis of financial statements, business
Analysis of financial statements, the company is an important step to help businesses understand the financial situation, optimize cash flow, evaluate the performance of operation, control risks. To achieve accurate results, businesses need to use the method of financial analysis in accordance with each specific target.
Here are five common methods and most effective in the analysis report:
5.1. Analysis method according to the ratio of financial
Ratio analysis of financial help measure financial performance via key indicators, from which assess solvency, efficiency of use of assets, financial leverage and profitability of the business.
- Liquidity ratio – reviews ability to pay short-term debt: The liquidity ratio reflects the level of availability of short-term assets to meet financial obligations in the short term.
- The ratio of financial leverage – evaluate the level of use debt to finance operations: the Ratio of financial leverage help assess the risk level of the enterprise related to the use of loans.
- Efficiency ratio operation – performance Evaluation-use assets: the Ratio of effective activities that help the business determine the level of use of assets to generate revenue.
- Rate of profit – reviews profitability of the business: the Ratio of profit to help businesses assess the level of profit from revenue and capital investment.
5.2. Methods trend analysis
Trend analysis to help businesses track the volatility of the financial ratios over time, from which recognizes the important changes, forecast financial trends in the future.
- Trend analysis can apply for revenue, profit, cash flow, cost to find out the pattern of development of the business.
- Business can compare the data in 3-5 years nearest to detect the trend of growth or decline.
- If revenues increase but reduced profitability, businesses need cost analysis to find the cause.
For example, If the business had revenue increased by 15% every year, but net profit increased by only 5%, this can be signs operating costs are rising faster than revenue.
5.3. Methods of horizontal analysis (Comparative Analysis)
Horizontal analysis help businesses compare financial statements of different years to assess the change over time.
- Businesses can compare revenue, profit, fixed costs, liabilities over the years to detect abnormal fluctuations.
- Detect an increase or decrease in the suddenness of the item financial to find the cause and adjust strategy.
For example, If operating costs increase by 30% while sales increased by only 10%, the business should check the expenses are reasonable or not.
5.4. Methods of analysis vertical (Common-size Analysis)
Analysis along to help businesses rate the item and finance according to the total revenue or total assets, helps to compare data more easily.
- For example, personnel costs accounted for how much percent on total revenue?
- If financial costs account for a large proportion, business may be dependent on the loan too much.
5.5. Method cash flow analysis
Cash flow is the most important factor to ensure the business can maintain operations, debt payment, investment and development.
- Cash flows from operating activities: If positive, the business can self-financing for the operation.
- Cash flow from investing: If continuous, businesses can now expand its operations.
- Cash flow from financing: If positive, the business can are taking on debt to finance operations.
For example: If the business has cash flow from business operations in 3 years in a row, this can be a sign of financial risks serious.
6. The tool supports analysis of financial statements
In the context of transformation of the use of the tools support the analysis of financial statements, business help automate the process of calculation, data visualizations, take financial decisions fast more accurate. Two popular tools now include Excel – tool, the traditional but still effective Business Intelligence (BI) solutions financial analysis with modern AI and real-time data.
6.1. Excel – tool tradition but effective
Excel provides many financial functions – statistics help business analysis, financial indicators important:
- NPV (Net Present Value): Calculate the net present value of an investment project, help to assess profitability.
- IRR (Internal Rate of Return): Determine the rate of payback of the investment.
- ROA (Return on Assets) and ROE (Return on Equity): performance Evaluation using assets and equity.
- Liquidity ratios (Current Ratio, Quick Ratio): Determine the solvency of the business.
For example, Businesses can use the function =NPV(0.1, A2:A10) to calculate the present value of cash flows with a discount rate of 10%.
Application PivotTable to analyze data quickly
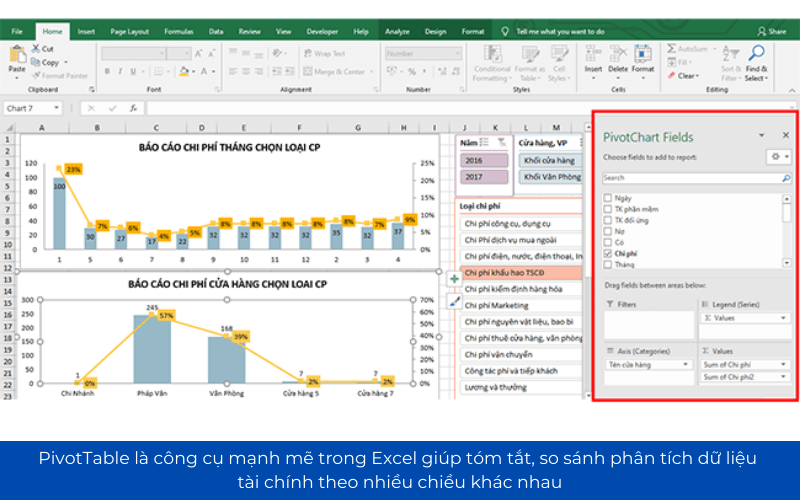
PivotTable is a powerful tool in Excel that helps summarize, compare, analyze financial data in many different directions. Some common applications:
- Create financial reports mobile: allow To change the parameters (the fiscal year, department, cost type) to analyze flexible.
- Trend analysis, revenue, cost: Businesses can quickly view revenue by month by month, quarter, or year to detect the growth trend.
- Compare financial performance between periods: Help identify changes in the financial structure given the proper adjustment.
Although versatile, Excel has some limitations:
- Does not support real-time data: financial Data on Excel often have to update manually, which leads to the risk of errors.
- Difficulty scale: When financial data becomes more complex, the management by Excel will take a lot of time, easy to errors occur.
- Teen intuitive features powerful: Compared to other BI tools, Excel does not have the ability to create dashboard finance to monitor the financial situation in real time.
To overcome these limitations, businesses can combine Excel with tools, Business Intelligence (BI) to improve the efficiency of financial analysis.
6.2 Vietnam Financial AI Agent tool – BEARING financial intelligence for enterprises
Vietnam Financial AI Agent is BI system in Vietnam, the first in-depth analysis, financial reporting, forecasting, risk, optimize cash flow.
- Support financial reporting standard IFR/VAS.
- AI analysis of health financial help businesses detect cash flow risks.
- Visualization data dashboard mobile support financial queries using natural language.
- Integrates well with AccNet, SAP, accounting software in the country.
For example, A business can use Lac Viet Financial AI Agent to track financial trends, automatic warning when the cost exceeds the budget allows.
6.3 Power BI – tools of financial analysis strong from Microsoft
Power BI is BI platform popular many businesses used to visualize financial data and automatically generate reports and integrated AI financial analysis.
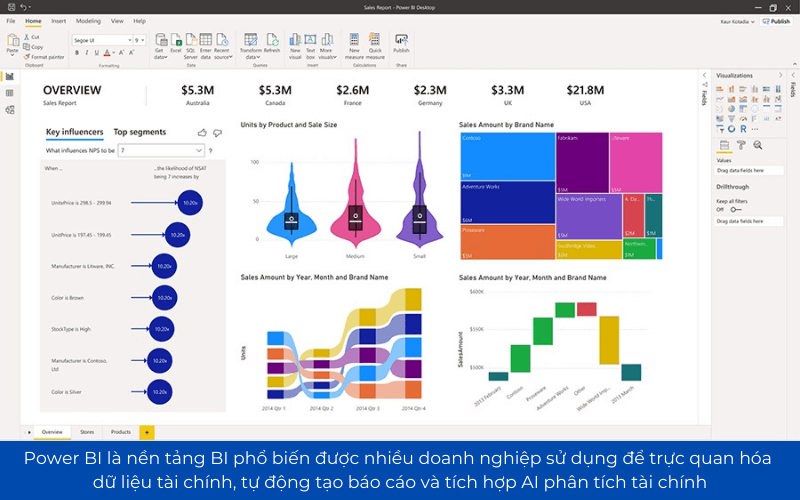
- Support connect with Excel, SQL Server, AccNet, SAP, Oracle to sync financial data.
- Create dashboard financial activities help the CEO, CFO track revenue, profit, cost in real time.
- AI-driven Insights: trend detection, financial risk warning model-based AI.
For example, A business can use Power BI to detect trend decrease in revenue in the last 6 months and adjust business strategies in a timely manner.
6.4 Tableau – tool BI-depth visualization financial
Tableau featured with the ability to visualise data strongly support financial analysis, in-depth special business suits have the volume of major financial data.
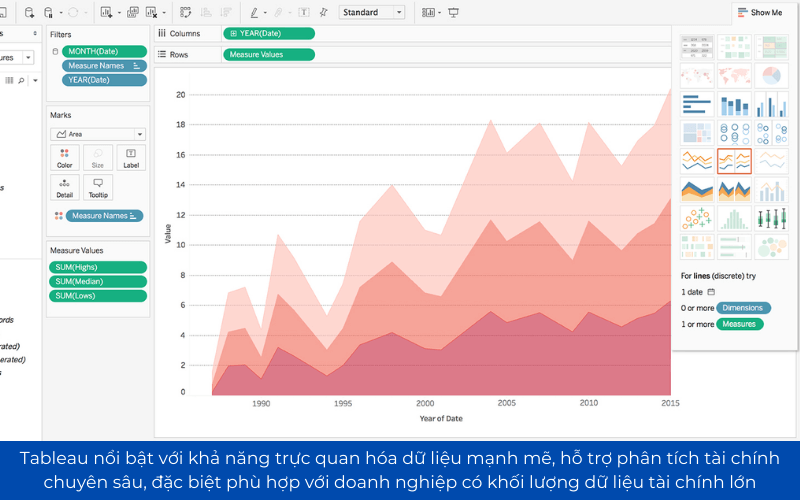
- Strong connection with financial systems such as SAP, QuickBooks, Oracle.
- Integrated AI Einstein by Salesforce help financial forecasting, trend detection profit.
- Handle financial data (big Data), suitable for business has many branches, multi-national corporations.
For example, A manufacturing company can use Tableau to compare financial performance between the plants in the system helps to optimize costs and increase profits.
6.5 Looker – BI on platform Google Cloud for financial analysis in-depth
Looker is BI platform is Google developer expert on the analysis of financial data in real time, processing big data (Big Data Analytics).
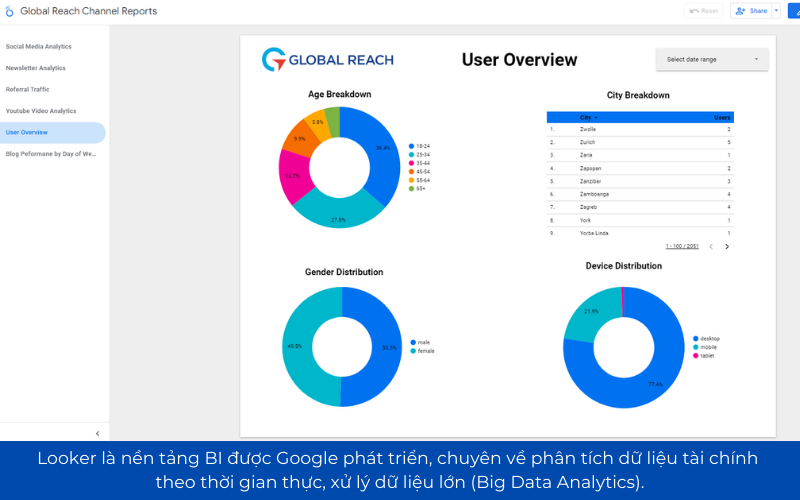
- Connect directly with BigQuery, help businesses analyze financial data from various sources.
- Integrated AI and Machine Learning, support, cash flow projections, profit based on historical data.
- Custom pattern analysis, financial flexibility, in accordance with the business system complex data.
For example, A bank can use Looker to forecast the credit risk based on customer behavior, to help control the rate of bad debt.
7. New trends in the analysis of financial statements
Analysis of financial statements is experiencing significant changes thanks to technology, big data (Big Data), artificial intelligence (AI), the financial standards international as IFRS. These technologies not only help business process automation, financial analysis, but also enhance the accuracy, the ability to forecast, optimize cash flow. Here are three important trends that businesses need to note when deploying.
7.1. Apps, AI and Big Data in financial analysis
The role of AI in the analysis of financial statements
Artificial intelligence (AI) is revolutionizing the way businesses analyze financial data to help automate the process, calculate, evaluate, forecast financial trends. The apps are important in financial analysis including:
- Revenue forecast costs: AI uses historical data to predict revenue growth, trends, costs, fluctuations in profit in the future.
- Anomaly detection in financial reporting: AI can automatically scan the financial statements and warnings of unusual transactions, helps to detect errors in accounting or financial fraud.
- Optimization of cash flows: help, cash flow projections, analysis of spending patterns, from which the proposed strategy to cut costs or optimize capital.
For example, a business e-commerce can use AI to predict revenue peak season based on purchase data in the past from that plan financial fit.
Big Data helps to analyze financial data, multi-dimensional
Big Data allows businesses to collect, process, analyze large amount of financial data from various sources to help optimize financial decisions.
- Financial analysis in real time: Instead of relying on monthly reports, Big Data helps enterprises track financial situation day by day, hour by hour.
- Combine multiple sources of financial data: Big Data, data integration from ERP software, accounting software, bank transaction data, macroeconomics, helps enterprises with more holistic view.
- Reviews financial risk based on big data: AI can scan millions of transactions to identify risk, liquidity risk, repayment capacity, fluctuations in cash flow.
For example, a manufacturing business can use Big Data to analyze trends in raw material prices in the last 5 years, from that given on the strategic reserve inventory more efficiently.
7.2. Convert numbers and automation of financial statements
Integrated ERP software and Business Intelligence (BI)
Convert numbers in financial analysis to help businesses automate the process of synthesis, analysis, visualization financial data, thanks to the integrated ERP system and BI.
- ERP (Enterprise Resource Planning) that helps business focus financial data from multiple departments, ensuring the correct consistency.
- Business Intelligence (BI) such as Power BI, Tableau helps visualize financial statements by the dashboard automatically analyze in real-time.
- AI in BI can analyze financial data, automatically put out the alert about financial risk, cash flow and business performance.
Automation of financial statements in real time
Previously, businesses have to take several weeks or months to aggregate financial statements. However, with the development of technology, businesses can create financial statements instantaneous without the need for manual intervention.
- Automatic synthesis of data from accounting software, banking system, ERP.
- Update the report immediately when there are changes in cash flow, revenues, and expenses.
- Minimize accounting errors, increase transparency in financial reporting.
For example, an import-export business can use BI tools to monitor fluctuations in foreign currency exchange rates in real time, from which adjust the strategy of international payments more efficient.
7.3. Applied standards IFRS into the analysis of financial statements, business
Trend switch from VAS to IFRS
Many businesses in Vietnam are in the process of transition from the accounting system of Vietnam (VAS) to Reporting standards international Financial (IFRS) to meet the requirements of fiscal transparency, attract international investment capital.
- IFRS allows financial analysis in more depth thanks to the standard transparency report, in detail.
- Support business access to capital international growth opportunities listed on the international stock.
- Facilitate comparison of financial easily between the multinational enterprise.
For example, a business FDI activities in Vietnam can apply IFRS to easily compare financial results between parent company and affiliates worldwide.
Application of technology to support financial analysis under IFRS
The application of IFRS requires businesses to standardize financial data, apply the accounting model new process automation report. Technology solutions to help this process become easier:
- ERP support financial reporting under IFRS: The system such as SAP, Oracle NetSuite help businesses implement reporting standards IFRS without the need for structural changes in accounting too much.
- BEARING support analysis of financial data under IFRS: tools such as Power BI, Tableau helps visualize financial data comparison report according to VAS and IFRS.
- AI automatic conversion financial reporting under IFRS: A number of tools AI support, automatically translate accounting data from VAS to IFRS, reducing the time cost of conversion.
For example, a bank can use AI to automatically classify financial assets under IFRS 9, which helps optimize the analysis of credit risk.
To finance management efficiency, enterprises need to combine between experience, methods of financial analysis intensive modern technology to maximize the profit, minimize risk and create competitive advantage sustainable. If your business is not yet implemented analysis of financial statements, business one way system science, this is the right time to the application of these methods, modern tool to improve financial performance and promote sustainable growth.


![[ĐẦY ĐỦ] Mẫu báo cáo tài chính, tình hình tài chính file excel theo Thông tư 200 và 133](https://lacviet.vn/wp-content/uploads/2025/04/mau-bao-cao-tai-chinh.png)