
For many years, many businesses especially small and medium enterprises still a decision sales, resource allocation or promotion according to the sense or personal experience. Can today find the product A selling then increases daily, saw up, then rushing to push advertising. However, perception is not always true to reality, if there is no data platform, the administrator will gradually become risks difficult to control when the scale businesses to expand.
As practice shows, the business pioneer in the analysis of sales data typically achieve greater efficiency markedly in terms of revenue and operational efficiency. Simple reason: they understand what is happening not only based on speculation that based on the numbers of specific objective.
In customer behavior rapidly changing market competition is increasingly fierce, analyze data, sales is no longer an advantage which option is a capacity required. Business need to look deep into the data to:
- Know is where is selling products, seasonal and area
- Early detection of the trend decline in sales before it's too late
- Identify potential customers to invest in the right spot
- Evaluate the effectiveness salesperson or marketing campaign
This article is Lac Viet built to help businesses better understand data analysis, sales, what is, how to implement, and what makes the data became an “assistant” strategy, not merely a report last month.
1. Analyze sales data, what is? Why business should not ignore?
1.1. Definition
Analyze sales data is the process of collecting, handling, analyzing the information related to sales activities in order to find the rule, the trend indicators important to serve the decision more accurate in the business.
Instead of looking at the revenue figures according to how pure analytics help businesses understand more deeply: what products are selling well? Customers come from? They often buy on time? Those items which are showing signs of leveling off or inventory long? Employees who are achieving the best performance? The real reason behind the numbers is what?
Some types of data, popular sales needs analysis:
- Revenue over time (day, week, month, quarter)
- Revenue by product, product group, brand
- Performance by sales channel (online, physical stores, dealers, floor ecommerce)
- The conversion rate from prospects into buyers
- The frequency of repeat purchase and order value average
- Customer behavior: the time of purchase, products or buy any feedback after the purchase
For example, if your business noticed sales items A spike at the end of the week in the Southern region, they can increase advertising budget to the time frame and this location to optimize marketing costs.
1.2. Strategic benefits that business get
Data analysis not only helps to “re-read” business activity took place, but also towards the future help businesses predict for early action to seize opportunities, minimize risks. Here are the practical benefits:
- Increase in revenue thanks to properly understand the products and target customers: When data analysis, sales, business easily identify products, customer groups have high value and time of the most effective sales. From there, promoting sales campaigns or new product launches also become base rate of success is higher.
- Manage inventory better to avoid waste: Understanding speed sold, rotation of inventory, seasonal demand will help businesses predict right to demand goods from then, reduce inventory, avoid stagnant capital, limit order obsolete.
- Advanced performance sales team: Data analysis, sales staff help properly evaluate individual performance, recognizes people who are doing well to replication, at the same time supporting the training of the weak, based on data objectively.
- Optimal marketing campaign, promotion policy: Through data, shopping behavior, feedback following promotion, the business can adjust the content, the time and form of marketing more suitable to avoid wasting your budget on the campaign ineffective.
According to a report from McKinsey, the business applied data analysis in sales can increase by 10-20% revenue save up to 15% of the marketing costs thanks to optimized strategy to focus the right resources.
Data analysis is not technically reserved for large corporations. With the right tools, even small businesses can also understand the customers, more sales intelligence optimizing every business decision, every day. This is a foundation to build a sales system, modern transparent has the ability to adapt quickly in market volatility.
2. The shape analysis of sales data, the most popular
Data analysis sales not merely the statistics of the numbers has occurred, which is also a process that helps the business understand the causes, predict the future to give optimum action. To do this, the business can reach the 4 levels of analysis, from basic to advanced, to suit each stage of maturity in data management.
2.1. Analysis description “look back to understand what happened”
This is the most basic level in data analysis. The main objective is to answer the question: “what happened?”
Business use descriptive analysis to aggregate sales data in the past, given intuitive view of business performance.
Illustrative examples:
- Total revenue in each month, each quarter
- The number of orders by sales channel (website, Facebook, store)
- The chart compares the proportion of revenue between product groups
Practical benefits: Helps leaders understand the whole picture, get to know the trend of growth or decline over time. This is the foundation needed before going into the analysis forms the more advanced.
2.2. Diagnostic analysis “to find out the reason behind the numbers”
At this level, the analysis does not stop at the presentation of data that goes deeper to answer: “why did that happen?”
Businesses can dig deep to uncover the cause of reduced revenues or completion rate single rose high.
For example:
- Revenue months 6 plummeted. Data shows that this is mainly coming from the product group A for strong prices.
- Rate orders, suspended high in the Central region, after analysis showed that the cause comes from delayed delivery time due to shipping partners new.
Practical benefits: Helping businesses do not act according to the sense which is based on the specific cause. This is particularly useful when adjusting the product strategy, distribution channel or promotion policy.
2.3. The analytical predictions “forecast the future from past data”
This is a further step, using the statistical model and machine learning (machine learning) to forecast future trends. Questions focus is: “what will happen if...?”
Illustrative examples:
- Predictable revenue next quarter if you continue to keep the costs of your advertising budget current
- Estimate the likelihood of acquisition of customers after they complete the order first
- Forecast products going out of stock in 2 weeks based on speed current sale
Practical benefits: the analytical predictions to help businesses proactively planning of inventory, personnel, marketing budget. Instead of just reacting with the results happened, the business can prepare in advance to take advantage of the opportunity to avoid risks.
2.4. Analysis proposed “hint optimum action”
This form of analysis most advanced, incorporating past data, predictive modeling and optimization algorithms in order to propose the most effective action. Questions to be answered: “what should We do next?”
Illustrative examples:
- Hint system to increase the budget to run ads product B at the Hanoi area happy hour 19h–21h because there is a high conversion rate the most
- Proposed reduction product group inventory longer than 45 days to stimulus that does not affect the profit margin
- Automatic allocation targets for sales staff based on region, product, performance history
Practical benefits: analysis of proposals to help business decision making fast, accurate, optimized resources. Especially useful for businesses large-scale, complex data or operate multi-channel.
3. Process analysis sales data of business
Analyze sales data is a systematic process, not merely the synthesis of several tables revenue last month. To be effective, businesses need to follow the clear step from collecting, cleaning, visualization to analyze and make recommendations for action. Below is the process 4 basic steps to suit every business model from medium to large.
3.1. Collect data from the source
This is the initial step is also the foundation of the entire analysis process. Sales data can come from many different systems need to be collected full sync to avoid deviations in step later analysis.
Data source common include:
- POS system (Point of Sale): collect sales data in store, including transaction time, product code, quantity, unit price.
- CRM (Customer Relationship Management): Recorded behavior, purchase history, customer feedback.
- Floor-commerce: Lazada, Shopee, Tiki... provides data about orders, views and product conversion rate.
- Accounting software – sales: inventory, discount, liabilities, costs related to each order.
- Social network, chatbot, email marketing: Recorded source of the customer, interaction, purchase behavior indirectly.
Important note: don't just collect enough data, businesses need to ensure that data has high accuracy, timely updates to avoid duplicate. Data error or lack of will directly affect the quality of analysis.
3.2. Clean data processing
“Raw” data after collecting often contain much redundant information, false or not consistent format. It is therefore necessary processing to ensure data can be used for analysis.
The work in this step include:
- Remove duplicate data or unusual: For example, a sales order is recorded twice or negative revenue due to false data entry.
- Complete additional value missing: Such orders, lack of product code or price.
- Standardized formats: Ensure the data fields such as date, currency code, product... have the same standard.
- The data connection between the system: Ensure the client code from CRM and sales systems fit together to analyze purchase behavior wholeness.
Value brings: When clean data, businesses can trust the results analysis. Conversely, if you skip this step, all the dashboard chart, although beautiful to now also easily lead to wrong decisions.
3.3. Data visualizations
Instead of looking at raw data in table form in the long-hundreds of the line, visualization helps convert data into charts, heat maps, graphs or tables to user “to see the story behind the number.”
Some common forms:
- Column chart, line: comparison of revenue over time according to product group.
- Heat map (heatmap): specify the time point of sale high point of the day or according to geographical area.
- Dashboards interactive: allows To filter data by month, employees, sales channel to track the results in detail.
Application example: A retail chain using graph heatmap to detect that the amount of orders spike to 20h–22h Friday every week. From there, they increase the advertising budget, Facebook in this time frame to the optimal cost.
3.4. Given analysis recommendations action
The last step, and is also the most important: turning data into real action. This doesn't just stop at the comment, but also to conclude by the specific direction that the business should implement.
For example:
- If the product group A are the profit rate is the highest, but is reduced sales, should increase the discount or marketing campaign.
- If direct sales channel at the store reaches sales lower than online, it is necessary to review the layout, staff training, or price policy.
Archive periodic reports: Business should be reported according to quarter, or month, store history analysis to compare trends from the that not only “correct” but also do better in the future.
Analyze sales data can not be effective if ignore one of the four steps above. When fully implemented from collecting to processing, intuitive and recommendations. Business doesn't just stop at the “know how” but also know what I need to do to sell better in the next time.
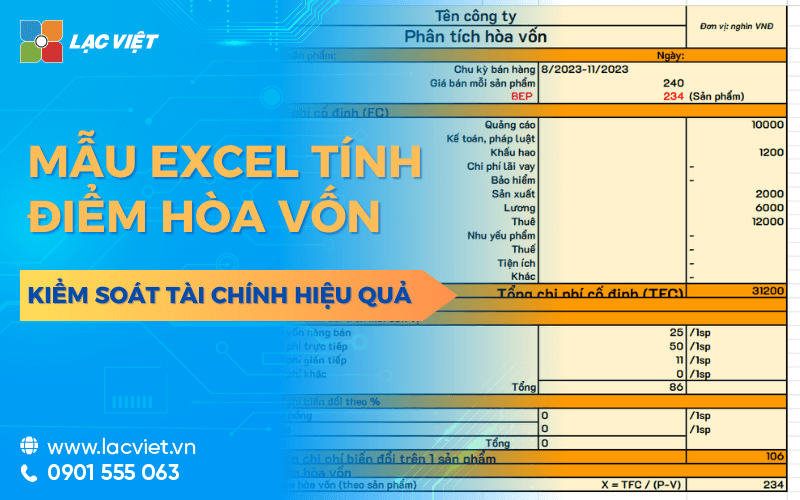
- The breakeven point and 6 Pattern analysis of the breakeven point STANDARD EFFICIENCY
- Guided reading, analysis, reporting the results of operations of the company's business
- Statement analysis cash flow read out on the BC REAL details
- Analysis of financial indicators business: recipe and meanings 15 financial indicators
4. Tools to support data analysis, sales effectiveness
The analysis of sales data will not achieve effective if you just stop at thinking “look at table – hand”. To turn data into competitive advantage, businesses need to use these tools in accordance with the scale, goals and the ability to operate current. Here are three common tools, each suited to each maturity level of the business in data management.
4.1. Excel advanced – flexible options for small and medium enterprises
Microsoft Excel has long been a tool of analysis familiar in an enterprise environment. However, in order to serve the purpose of data analysis, sales, users need to use the advanced features as:
- Pivot Table (table aggregated automatically): Help quick stats revenue by products, regions and employees.
- Slicer, filter data: allow filter by period, customer group in an intuitive way.
- VLOOKUP, INDEX – MATCH: connect data from many different tables that make up the flexible reporting.
Advantages:
- Low cost, easy to deploy even if the team was familiar to Excel users.
- Flexibility in manipulating the data structure.
Restrictions:
- Easy-to-happen errors if the lack of process control data entry.
- Hard open wide when big data or need analysis in real time.
- Does not fit with the business to operate multi-channel, multi-branch, or need to share reports quickly.
When to use: Suitable for small businesses, the number of orders is not too large, need to track sales effectiveness, basic, no team in-depth analysis.
4.2. Google Looker Studio, Power BI data visualizations effective, easy to deploy
When business need a new step in the way presented, track sales data, the visualization tool such as Google Looker Studio (formerly Data Studio) and Microsoft Power BI is the right option.
Feature highlights:
- Connect data sources: Google Sheets, Excel, sales software, CRM...
- Create a Dashboard action: allow drag and drop, filter the data by time, product, region,...
- Easy to share: can send link for management or employees track directly, no need to send file frills.
Advantages:
- Low cost or for free (with Google Looker Studio).
- Friendly interface, no need technical knowledge intensive.
- Increase transparency, speed in decision-making.
Restrictions:
- Need building skills report to understand the data model basic.
- Latency when connected to some external data source.
When to use: Suitable for small and medium sized businesses want to convert from Excel to dashboard, modern, and share data quickly with the entire sales department, marketing, management.
4.3. Analytics platform integration LV Financial AI Agent: From data to action smart
For business had operated on many different platforms (software sales, accounting, CRM...) need a tool to automatically collect, analyze, and propose solutions based on sales data, then the solution is as LV Financial AI Agent is the optimal choice.
Lac Viet Financial AI Agent to solve the “anxieties” of the business
For the accounting department:
- Reduce workload and handle end report states such as summarizing, tax settlement, budgeting.
- Automatically generate reports, cash flow, debt collection, financial statements, details in short time.
For leaders:
- Provide financial picture comprehensive, real-time, to help a decision quickly.
- Support troubleshooting instant on the financial indicators, providing forecast financial strategy without waiting from the related department.
- Warning of financial risks, suggesting solutions to optimize resources.
Financial AI Agent of Lac Viet is not only a tool of financial analysis that is also a smart assistant, help businesses understand management “health” finance in a comprehensive manner. With the possibility of automation, in-depth analysis, update real-time, this is the ideal solution to the Vietnam business process optimization, financial management, strengthen competitive advantage in the market.
SIGN UP CONSULTATION AND DEMO
Feature highlights:
- Connection cross platform: sync your data from software sales, accounting system, CRM helps to see the overall picture.
- Trend analysis-automatic: detection of fluctuations in sales by region, employees, products that does not need filter crafts.
- Performance comparison: evaluating the effectiveness between the product group, the business helps managers decision to adjust resources in a timely manner.
- Proposed action (AI-driven): the hint System group discounts products, high inventory, increased advertising for items that are profit margins high at the moment.
Enterprise value received:
- Save time report: From few synthetic data down to just a few minutes.
- Proactive decision-making: early Warning when sales are unusual signs.
- Optimal sales effectiveness: The only goal of accurate, coordinated goods timely, not – not missing.
When to use: Suitable for business, medium – large, has many branches, operate multi-channel or are converting a number of strong need an “assistant” data reliable.
Sign up to receive demo platform, intelligent analysis LV Financial AI Agent at:
https://lacviet.vn/lac-viet-financial-ai-agent
Analyze sales data is no longer far fetched concept or privilege of the business technology. In the context of fast moving market, customer behavior is constantly changing and the competition is getting fiercer, then business does capture the business data that has the advantage. Understanding yourself is selling what to whom sold, effective, what should I do next will help you not only to react flexibly, but also actively lead the market.


![[ĐẦY ĐỦ] Mẫu báo cáo tài chính, tình hình tài chính file excel theo Thông tư 200 và 133](https://lacviet.vn/wp-content/uploads/2025/04/mau-bao-cao-tai-chinh.png)

![[Trọn bộ] File Excel mẫu báo cáo chi phí sản xuất kèm hướng dẫn lập chi tiết](https://lacviet.vn/wp-content/uploads/2025/02/bao-cao-chi-phi-san-xuat.png)