
Data analysis business is becoming an essential element in business management modern. In the context of competition is increasingly fierce, with the rapid development of technology, businesses can't just rely on intuition to make decisions that need to leverage data to get the accurate analysis, in a timely manner. The application analyzes data to help businesses optimize performance and predict market trends contribute to improving competitiveness.
This article Lac Viet will help the business understand data analysis, the method of common, useful tools and how the application into practice to optimize operational efficiency, sustainable growth.
1. Data analysis what is business?
1.1 definition, data analysis, business
Data analysis business is the process of collecting, processing, analyzing, and visualizing data to make strategic decisions in business. Through the use of tools, methods of analysis, businesses can transform raw data into valuable information, from which to make decisions accurately, optimize operations, predict the future.
Data analysis includes many different levels, from the description of data, detect trends, predict risks to proposed solutions business intelligence.
1.2 the Role of data analytics in business
Data analysis business not only help businesses understand the financial picture of commissioning, but also bring many important benefits such as:
- Decision support based on the actual data: Instead of relying on sentiment, businesses can rely on pattern analysis data to make decisions quickly and accurately.
- Optimized financial strategy business: Data to help businesses determine what products/services effectively, optimize operating costs, adjust marketing strategies accordingly.
- Advanced performance activities: to Help businesses identify strengths and weaknesses in business processes, thereby improving operational efficiency.
- Forecast market trends: data analysis help businesses identify new opportunities, predict customer trends, adjust strategy to catch the market.
For example, A retail company can use data analysis to track purchasing trends of customers, optimize inventory management, improve customer experience, thereby increasing revenue.
2. Why business need, data analysis, business?
In the era of digitization, businesses can reach a huge amount of data from various sources such as sales data, financial data, customer data and data operation. However, if there is no strategy, data analysis, effective business will be difficult to leverage maximum value from this data.
Here are the main reasons why data analytics business become necessary for every business:
2.1 decision Support based on data
- Help businesses make decisions faster, more accurate, reduce risk.
- Provides real-time data to help leaders angle correct about the business situation.
For example: A company e-commerce use data analysis to determine the selling products, optimize product portfolio.
2.2 optimization strategy finance business
- To help businesses understand spending patterns, adjustable reasonable budget.
- Define channel marketing most effective way to optimize the cost of advertising.
For example, A manufacturing business use data to optimize supply chain, reduce costs of storage and operation.
2.3 Improve performance and trend forecasting
- Data analysis help businesses enhance performance, personnel, process optimization work.
- Forecast consumer trends to help businesses proactively market to meet customer needs.
For example, A bank uses AI to analyze customer data, detect fraud and proposed financial products is suitable.
3. The method of data analysis business popular
Businesses can apply various methods to harness the value from business data. Here are four methods of data analysis, the most important:
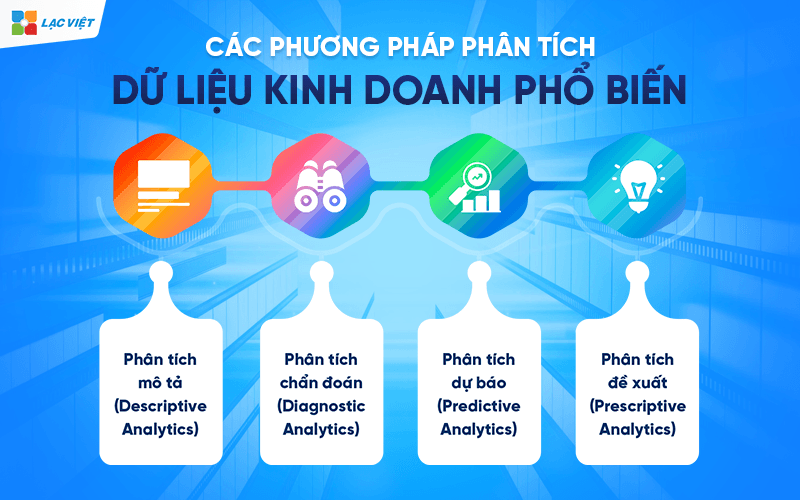
3.1 descriptive analysis (Descriptive Analytics)
Is the most common method to help businesses understand the past by synthetic data display.
Main tool: Dashboard (dashboard), financial reports, charts visually.
For example, A retail business using descriptive analysis to track sales by each month, from which adjust business strategy, seasonal.
3.2 analysis of diagnostic (Diagnostic Analytics)
- Help your business find out the cause behind the fluctuations in financial or business.
- Use the statistical model to determine the factors that affect business performance.
- For example, If sales fell sharply in a specific area, businesses can use the diagnostic analysis to identify causes such as price, competition, or consumer trends change.
3.3 forecast analysis (Predictive Analytics)
- Based on historical data to predict trends, future scenarios.
- Apps, AI and Machine Learning to forecast sales demand market or financial risk.
For example: An insurance company uses predictive analytics to estimate the proportion of a claim in the future, help to adjust the appropriate premium.
3.4 analysis recommendations (Prescriptive Analytics)
- The highest level of data analysis help businesses make recommendations based on actual data.
- Application in optimization, operational, financial, marketing.
- For example: A business logistic use the analysis to propose to the optimal delivery route, minimizing the shipping costs.
4. The type of important data in business analysis
In the process of analyzing business data, identifying the right kind of data have a large influence on effective decision-making, optimization, operation and improve financial performance. Business data can be divided into four main groups: financial data, customer data, data commissioning, production, marketing data, sales. Each data group, this brings the different values, plays an important role in the analysis, forecast and adjust business strategy.
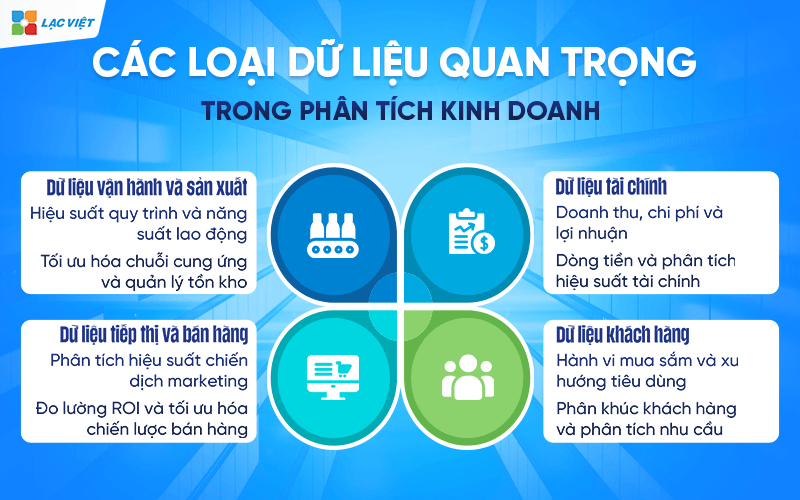
4.1. Financial data
Financial data is the foundation of every decision in business. This is the data group to help business reviews, financial situation and performance measurement activities, plan your budget effectively.
Revenue, cost and profit
- Revenue: Total income from business operations can be analyzed according to each product, service, region or time.
- Cost: Includes fixed costs (rent, staff salaries), variable costs (raw materials, transport).
- Profit: important indicators to assess business performance, including gross profit, net profit and profit margin.
Application analysis of financial data:
- Determine which products/services are most profitable to cut these expenses are not necessary.
- Trend analysis, profit to financial planning long-term.
Cash flow analysis and financial performance
- Operating cash flows: Cash real business gain from business activity.
- Cash flow and investment: The investment in fixed assets, stock or expansion project.
- Cash flow financing: cash Flow from loans or raised from shareholders.
Application data analysis cash flow:
- Tracking cash flow in/out to ensure solvency.
- Phát hiện vấn đề về quản lý tài chính, tránh tình trạng mất cân bằng trong quản lý dòng tiền trong kinh doanh.
For example, If cash flow analysis shows businesses often suffer from a shortage of liquidity at the end of the month, can businesses need to adjust the policy on debt collection or optimize operating costs.
4.2. Customer data
Customer data to help businesses understand consumer behavior, needs, buying habits, from which building strategic approach effective.
Shopping behavior and consumer trends
- Frequency of purchase: how often customers return to buy products/services.
- Order value average (AOV – Average Order Value): the Total value of transactions on average each purchase.
- Product/service preferred: The categories are customers most interested in.
Application analysis of customer data:
- Adjust the product portfolio according to the actual demand.
- Optimized pricing strategy, promotions.
For example: If the business finds customers tend to buy more at the end of the week, can deploy the program discount or promotional more powerful at this point to increase revenue.
Customer segment – needs analysis
- Classify customers by age, gender, income, shopping behavior.
- Needs analysis preferences to personalize the customer experience.
Application analysis of customer data:
- Building marketing strategy according to each customer segment.
- Product development/new services in accordance with market demand.
For example: If your business noticed younger customers prefer to buy goods via e-commerce, can focus on promoting ads on the platform instead of traditional store.
4.3. Data operator production
Data operation and production help business performance management, labor optimization of the production process to minimize waste.
Process performance, productivity labour
- Production time on average: a Measure of time to complete each order or product.
- The error rate products: analysis of causes errors in the production process.
- Labor efficiency: a Measure of work productivity of employees.
Application data analysis operators:
- Optimized the production process to reduce the time and operating costs.
- Improve product quality by identifying the cause of the error.
For example, If data indicate that a stage production had the error rate is high, businesses can re-check process, improved technology to minimize risk.
Optimized supply chain inventory management
- Inventory turnover: Determine the speed of consumption goods.
- Inventory safety: Guarantee top quality sufficient to avoid deficiency or excess.
Application data analysis, supply chain:
- Improve demand forecasting to optimize the amount of inventory.
- Reduce the costs of storage, avoid waste of raw materials.
For example, If analysis data showed inventories rose, but sales fell, businesses need to adjust policy import or promote sales strategy to liberate inventory.
4.4. Marketing data sales
Marketing data sales to help businesses evaluate effective marketing strategy, performance measurement, sales, and optimize ROI (Return on Investment).
Analyze campaign performance marketing
- CTR (Click-through Rate): Measure the click through rate on ads.
- Index conversion (Conversion Rate): analysis of the ratio of potential customers who perform the desired action (purchase, registration).
Application data analysis, marketing:
- Determine the marketing channels is most effective to optimize the budget.
- Adjust the advertising content based on customer feedback.
For example, If data shows that email marketing campaigns are open rate, email low, businesses can test title more attractive or adjust the timing of the email.
Measure ROI and optimize sales strategies
- Revenue per sales channel: performance Evaluation each channel (online store, agent).
- Cost per potential customers (Customer Acquisition Cost – CAC): cost analysis to get a new customer.
Application analysis of sales data:
- Adjust pricing strategy based on market demand.
- Optimize sales model to increase revenue at the lowest cost.
For example, If analysis data showed that the conversion rate from ads, Facebook, higher than Google Ads, businesses can increase advertising budget on Facebook to optimal efficiency.
5. Hướng dẫn quy trình thực hiện phân tích dữ liệu kinh doanh chi tiết
Bước 1. Xác định mục tiêu phân tích dữ liệu
Việc xác định rõ mục tiêu phân tích dữ liệu là nền tảng quan trọng giúp doanh nghiệp tối ưu hóa quá trình ra quyết định. Một mục tiêu phân tích dữ liệu tốt cần phải cụ thể, đo lường được, có thể thực hiện, phù hợp với chiến lược kinh doanh, có thời hạn rõ ràng (SMART: Specific, Measurable, Achievable, Relevant, Time-bound).
Tại sao cần xác định mục tiêu trước khi phân tích dữ liệu?
- Giúp tập trung vào vấn đề cốt lõi: Tránh thu thập xử lý dữ liệu không cần thiết, tiết kiệm thời gian và tài nguyên.
- Tạo hướng dẫn rõ ràng cho đội ngũ phân tích dữ liệu: Đảm bảo các nhà phân tích hiểu rõ yêu cầu của doanh nghiệp.
- Định hướng chiến lược kinh doanh: Dữ liệu không có giá trị nếu không liên kết với các mục tiêu kinh doanh cụ thể.
Các loại mục tiêu phổ biến trong phân tích dữ liệu kinh doanh
- Tăng doanh thu bằng cách tối ưu hóa giá bán sản phẩm.
- Cải thiện hiệu suất hoạt động bằng cách phân tích hiệu quả sản xuất.
- Nâng cao trải nghiệm khách hàng thông qua phân tích hành vi tiêu dùng.
- Giảm chi phí vận hành bằng cách tối ưu hóa chuỗi cung ứng.
Bước 2. Thu thập dữ liệu kinh doanh
Thu thập dữ liệu là bước quan trọng trong quy trình phân tích giúp đảm bảo doanh nghiệp có đủ thông tin để đưa ra quyết định chính xác.
Bao gồm các nguồn dữ liệu cần thu thập sau:
Dữ liệu nội bộ
- Báo cáo tài chính: Doanh thu, lợi nhuận, chi phí.
- Dữ liệu bán hàng: Sản phẩm bán chạy, hiệu suất của từng kênh bán hàng.
- Dữ liệu khách hàng: Thông tin cá nhân, hành vi mua sắm, lịch sử giao dịch.
- Dữ liệu nhân sự: Hiệu suất làm việc, tỷ lệ nghỉ việc, chi phí lương.
- Dữ liệu sản xuất: Hiệu suất máy móc, thời gian vận hành, chi phí nguyên liệu.
Dữ liệu bên ngoài
- Dữ liệu thị trường: Xu hướng tiêu dùng, giá cả nguyên vật liệu, đối thủ cạnh tranh.
- Phản hồi khách hàng: Đánh giá trên mạng xã hội, khảo sát khách hàng, xếp hạng sản phẩm.
- Dữ liệu kinh tế: Lạm phát, tỷ giá hối đoái, chi tiêu người tiêu dùng.
Dữ liệu thời gian thực
- Dữ liệu từ website: Lưu lượng truy cập, tỷ lệ chuyển đổi, thời gian trên trang.
- Dữ liệu từ cảm biến IoT: Giám sát máy móc sản xuất, kiểm soát chất lượng sản phẩm.
- Dữ liệu giao dịch tài chính: Phân tích biến động dòng tiền theo thời gian thực.
Lưu ý khi thu thập dữ liệu
- Đảm bảo dữ liệu chính xác: Sử dụng nguồn tin cậy, tránh sai lệch số liệu.
- Tính toàn vẹn dữ liệu: Không bỏ sót hoặc ghi chép sai.
- Tuân thủ bảo mật dữ liệu: Bảo vệ thông tin khách hàng, tuân thủ quy định về dữ liệu cá nhân (GDPR, ISO 27001).
- Định kỳ cập nhật dữ liệu: Tránh tình trạng dữ liệu lỗi thời, không phản ánh thực tế kinh doanh.
Bước 3. Làm sạch và chuẩn hóa dữ liệu
Dữ liệu thô thu thập từ nhiều nguồn thường chứa lỗi, sai sót hoặc không đồng nhất. Làm sạch dữ liệu giúp loại bỏ những vấn đề này, đảm bảo chất lượng phân tích.
Các bước làm sạch dữ liệu:
1. Xóa dữ liệu trùng lặp: Khi thu thập dữ liệu từ nhiều hệ thống khác nhau, có thể xuất hiện các bản ghi trùng lặp. Ví dụ: Một khách hàng có thể xuất hiện nhiều lần trong hệ thống CRM do nhập liệu thủ công.
2. Xử lý dữ liệu bị thiếu: phương pháp thay thế dữ liệu bị thiếu
- Điền bằng giá trị trung bình, trung vị.
- Sử dụng giá trị gần nhất theo thời gian.
- Loại bỏ dữ liệu nếu tỷ lệ thiếu quá lớn.
3. Chuẩn hóa định dạng dữ liệu: Đồng bộ hóa đơn vị tiền tệ, đơn vị đo lường, cách ghi ngày tháng. Ví dụ, nếu một hệ thống lưu dữ liệu ngày ở định dạng DD/MM/YYYY còn hệ thống khác sử dụng MM/DD/YYYY, cần chuẩn hóa thành một tiêu chuẩn chung.
4. Xác thực dữ liệu: Kiểm tra logic của dữ liệu:
- Doanh thu không thể là số âm.
- Giá bán sản phẩm không thể nhỏ hơn chi phí sản xuất.
- Nhân viên không thể có số giờ làm việc lớn hơn 24 giờ/ngày.
Công cụ hỗ trợ làm sạch dữ liệu
- Microsoft Excel & Google Sheets: Tốt cho các tập dữ liệu nhỏ, có chức năng lọc, loại bỏ trùng lặp.
- SQL: Giúp truy vấn, hợp nhất, làm sạch dữ liệu từ nhiều hệ thống.
- Python (Pandas, NumPy): Hữu ích cho xử lý dữ liệu lớn, tự động hóa việc loại bỏ trùng lặp, xử lý dữ liệu bị thiếu.
- ETL Tools (Talend, Alteryx): Tự động hóa quy trình thu thập làm sạch dữ liệu.
Bước 4. Trực quan hóa dữ liệu
Bước này giúp doanh nghiệp hiểu rõ hơn về dữ liệu thông qua phân tích thống kê trực quan hóa.
Các phương pháp khám phá dữ liệu:
- Thống kê mô tả: Tính trung bình, trung vị, phương sai, độ lệch chuẩn của dữ liệu.
- Phát hiện xu hướng: Xác định xu hướng tăng trưởng doanh thu, mức độ biến động giá, hành vi mua hàng theo thời gian.
- Phân tích mối quan hệ: Xác định mối tương quan giữa các yếu tố như giá bán, doanh thu, chi phí marketing và số lượng khách hàng.
Tool support:
- Power BI, Tableau, Google Data Studio để trực quan hóa dữ liệu.
- Python (Matplotlib, Seaborn) hoặc R để phân tích dữ liệu chuyên sâu.
Bước 5. Xây dựng mô hình phân tích dự báo
Sau khi hiểu dữ liệu, doanh nghiệp có thể áp dụng các mô hình phân tích nâng cao để dự báo xu hướng, hỗ trợ ra quyết định.
Các kỹ thuật phân tích dữ liệu phổ biến:
- Phân tích hồi quy: Dự đoán doanh thu dựa trên các yếu tố tác động như chi phí quảng cáo, giá bán.
- Phân nhóm khách hàng (Customer Segmentation): Nhận diện nhóm khách hàng tiềm năng để tối ưu chiến lược marketing.
- Phát hiện bất thường (Anomaly Detection): Nhận diện giao dịch gian lận, biến động bất thường trong hoạt động kinh doanh.
- Dự báo chuỗi thời gian (Time Series Forecasting): Dự đoán nhu cầu sản phẩm, biến động thị trường.
Tool support:
- Python (Scikit-learn, TensorFlow) để xây dựng mô hình phân tích.
- Các nền tảng AI/ML như Google Cloud AI, Microsoft Azure Machine Learning
Bước 6. Đưa ra kết luận hành động
Dựa trên kết quả phân tích, doanh nghiệp cần đưa ra quyết định chiến lược, kế hoạch hành động phù hợp.
Ví dụ về hành động dựa trên phân tích dữ liệu:
- Nếu phân tích chi phí cho thấy một bộ phận tốn quá nhiều chi phí mà không tạo ra giá trị tương ứng, doanh nghiệp có thể tối ưu hóa hoặc cắt giảm ngân sách.
- Nếu dự báo nhu cầu cho thấy nhu cầu sản phẩm sẽ tăng mạnh trong tháng tới, doanh nghiệp có thể chuẩn bị thêm hàng tồn kho.
- Nếu phân tích hành vi khách hàng cho thấy nhóm khách hàng trẻ tuổi có xu hướng mua hàng nhiều hơn qua mạng xã hội, doanh nghiệp có thể tập trung đầu tư vào kênh marketing số.
Bước 7. Giám sát cải tiến liên tục
Phân tích dữ liệu là quá trình liên tục, doanh nghiệp cần theo dõi hiệu quả của các quyết định dựa trên dữ liệu, điều chỉnh chiến lược khi cần thiết.
Các bước giám sát cải tiến:
- Định kỳ cập nhật, kiểm tra dữ liệu để đảm bảo tính chính xác.
- So sánh kết quả thực tế với dự báo để điều chỉnh mô hình phân tích.
- Tự động hóa quy trình phân tích dữ liệu bằng AI để nâng cao hiệu suất.
Tool support:
- Hệ thống Business Intelligence (BI) để theo dõi KPI.
- Machine Learning để tự động cập nhật mô hình phân tích.
6. Các công cụ phân tích dữ liệu kinh doanh hàng đầu
In the era of digital data, the selection tools data analysis fit will help businesses optimize operations, financial management, efficiency and decision-making more accurate. Currently, there are many tools to support the business of collecting, processing, analysis, visualization of data, helps convert raw data into valuable information.
Here are four tools to analyze business data, leading, widely used in businesses, from small to large.
6.1. Lạc Việt Financial AI Agent – Giải pháp AI phân tích tài chính thông minh
Vietnam Financial AI Agent is tools of financial analysis integrated artificial intelligence first in Vietnam to help businesses automate financial reporting, forecasting, business trends, detect financial risks.
Feature highlights of Vietnam Financial AI Agent
- Automation of financial statements: the System automatically updates the aggregate data from accounting software, ERP systems, the data bank.
- Forecast financial intelligence: AI analyzes financial data in the past to predict profits, revenues, financial risk.
- Integrated BI Dashboard: Provides an intuitive interface to help businesses track the financial health in real time.
- Adhere to standard accounting IFRS/VAS: business Support, financial reporting according to international standards.
App Vietnam Financial AI Agent in the business
- Monitoring the financial situation in real time.
- Cash flow forecasting, early warning of financial risks.
- Performance analysis each branch, department, business department.
6.2. Power BI – Công cụ trực quan hóa dữ liệu mạnh mẽ
Power BI is a cross-platform data analysis developed by Microsoft to help businesses connect, visualize analyze data from many different sources. This tool allows to create the dashboard (dashboard) act, helps users to monitor the financial indicators, business performance in real time.
Salient features of Power BI
- Connect to multiple data sources: Power BI can connect to SQL Server, Excel, Google Analytics, accounting software, ERP system to aggregate data.
- Automation of financial statements: Business can set the report automatically updates in real time, reducing processing time data.
- Support AI & Machine Learning: integrating AI helps in trend analysis, revenue forecasting, anomaly detection in financial data.
- The ability to visualize: interactive Chart helps businesses easily track KPIS, profitability, cost and sales performance.
App Power BI in business analysis
- Financial analysis: monitoring reported profits, cash flow, cost analysis, revenue by region, product.
- Optimized sales process: Businesses can track employee performance, business, conversion rate, customer.
- Revenue forecast profit: Based on historical data, AI in Power BI can help businesses predict business trends.
6.3. Tableau – Công cụ chuyên sâu cho phân tích dữ liệu
Tableau is one of the tools, data analysis, most popular, especially in accordance with the business needs big data analysis (Big Data) and model building financial forecast and business. With drag & drop interface intuitive, Tableau helps businesses build reports, charts the complex without the need for programming knowledge.
Salient features of Tableau
- Support big data analysis: Processing, visualizing large amounts of data from many different sources.
- Build forecast models: application AI, statistical models to predict financial trends, revenue growth.
- Dynamic reporting: users can customize the report according to each perspective, filtering data in real time.
- Connected to many systems: Integration with SQL, Google Sheets, Excel, CRM systems, ERP to collect and analyze data.
Application Tableau in data analysis, business
- Analysis of financial performance: track only the number of profits, cash flow, budget allocation.
- Forecast consumer trends: construction model forecast customer demand, help optimize your marketing strategies.
- Analysis effective marketing campaign: tracking ROI, measuring ad performance across multiple channels.
6.4. Google Data Studio – Công cụ miễn phí cho doanh nghiệp nhỏ
Google Data Studio is a visualization tool data free, suitable for small businesses want data analysis, sales, marketing, finance, without the big cost.
Salient features of Google Data Studio
- Easy connection with Google Analytics, Google Ads, Excel.
- Create dynamic reporting, easily share with the management team.
- Integrate with Google Sheets to collect data quickly.
- Free, suitable for small business startup.
App Google Data Studio in the business
- Analyze sales performance in each channel, each campaign.
- Track advertising costs and ROI on Google Ads.
- Generate reports automatically without manual intervention.
In the context of competition increasingly fierce, any business data mining better will have greater advantage in the expansion of the market, enhance customer experience and sustainable development. Not to be left behind, businesses need to start investing in data analysis business right from today to build a solid foundation for success in the future.


![[ĐẦY ĐỦ] Mẫu báo cáo tài chính, tình hình tài chính file excel theo Thông tư 200 và 133](https://lacviet.vn/wp-content/uploads/2025/04/mau-bao-cao-tai-chinh.png)
![[Trọn bộ] File Excel mẫu báo cáo chi phí sản xuất kèm hướng dẫn lập chi tiết](https://lacviet.vn/wp-content/uploads/2025/02/bao-cao-chi-phi-san-xuat.png)