

In the business environment fluctuations, understanding the financial situation is key to help businesses maintain a stable and sustainable development. Financial analysis is not merely reviews financial statements, but also to help businesses identify trends, risk control, and take strategic decisions based on real data.
This article Lac Viet will help the business understand the method, financial analysis, financial indicators, important, and how the use of modern technology in the process financial analysis business.
1. Financial analysis what is a business?
Financial analysis business is the process of evaluation index through financial statements to understand the financial situation, performance, solvency of the enterprise. This process uses many different tools such as the ratio of financial analysis, cash flow, trend analysis and comparison with industry to make a decision exactly.
Financial analysis helps the business can look more clearly about performance, internal operations, helps investors, credit institutions, business partners, assess the level of safety, the potential development of the business.
Financial analysis plays an important role in the process of financial management and strategic decisions of the business. A number of main roles include:
- Provide overview about the financial situation: to Help businesses understand solvency, performance, use of capital, level of profitability.
- Support manager financial decisions: Based on real data, businesses can optimize costs, reasonable investment strategy adjustment, suitable business.
- Helps control the financial risks: financial analysis helps detect early warning signs of imbalance finance, bad debt or the cost of operation increases.
- Support investors and banking business assessment: The financial institutions, investors use the results of financial analysis to evaluate the creditworthiness of the business before making an investment decision or grant credit.
2. Tại sao cần phân tích tài chính doanh nghiệp?
2.1 Support strategic decisions
Financial analysis helps the business to identify the areas that need investment, expenses need to cut and opportunities to expand business. Based on financial data, businesses can:
- Strategic decisions capital funding: Use of loan funds or raise capital from shareholders.
- Identify investment opportunities: investment in fixed assets, technology or market expansion.
- Adjust business models: If the net profit decreased while revenue increase, businesses need to optimize costs to improve financial performance.
For example, if the rate of return on equity (ROE) decreased, businesses may need to re-evaluate the efficient use of capital restructuring financing.
2.2 control of financial risks
Financial risk is one of the factors that can cause loss of balance financial and affect the sustainable development of the enterprise. Some common risks include:
- Liquidity risk: Not enough cash to pay short term debts.
- Credit risk: bad Debt due to rising debt management is poor.
- Market risk: the Price of raw materials, fluctuations, increased production costs.
Phân tích tài chính giúp doanh nghiệp dự báo vấn đề tiềm ẩn và đưa ra biện pháp khắc phục kịp thời. Ví dụ, nếu chỉ số thanh toán nhanh (Quick Ratio) giảm xuống dưới 1, doanh nghiệp có thể cần tăng cường thu hồi công nợ hoặc điều chỉnh chính sách manage cash flow effectively hơn.

2.3 optimization, financial performance and cash flow management
One of the important elements of financial analysis is to help businesses optimize performance, use of assets, cash flow management efficiency and improve profitability.
- Optimize working capital: inventory control, increased rotation receivables to reduce the cost of finance.
- Optimized profits: a strategic adjustment price, cut operating costs not necessary.
- Cash flow forecast: Ensure that the business always has enough cash to maintain operations, invest in new opportunities.
For example, if the enterprise discovery inventory turnover decreased, this can be signs warning of the goods in the backlog, which affects cash flow and profit. When that business can adjust the strategy import or strengthen sales campaigns to promote consumption.
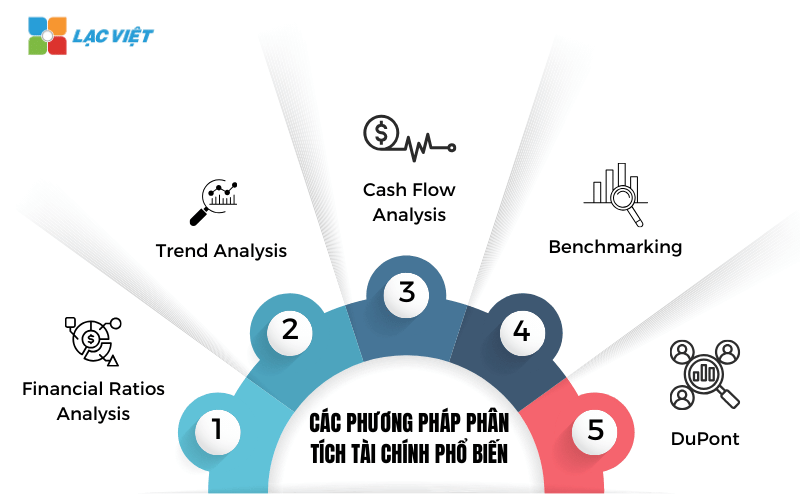
3. The method of financial analysis common
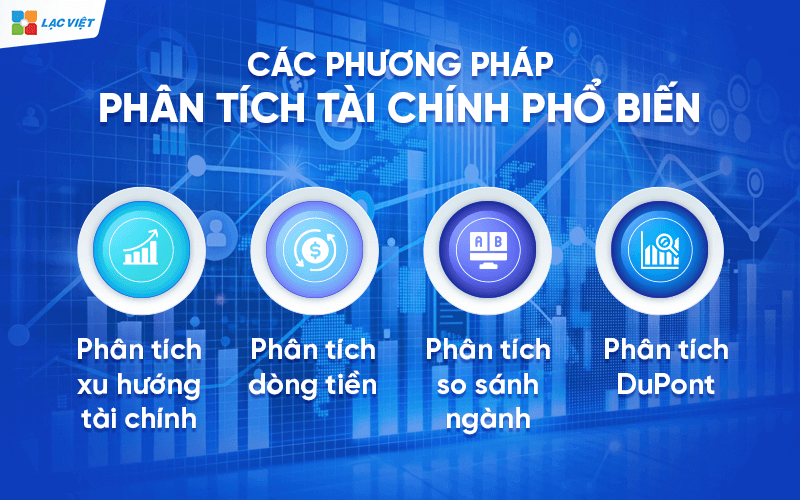
3.1 analysis according to the number of financial (Financial Ratios Analysis)
This method uses financial indicators important to assess the financial situation of the business, including:
- Liquidity indicators: assessing the short term solvency.
- Indicator of financial leverage: Determine the level of use of debt.
- Profitability index: assess the profitability of the business.
- Money flow index: a Measure of effective cash flow management.
3.2 analysis of financial trends (Trend Analysis)
This method helps business identify financial trends through each phase, compare the data between the states to take a decision on financial performance in the future.
For example, If net profit margin (Net Profit Margin) decreased continuously for 3 years, businesses need to review the pricing strategy, the cost of production or efficiency of business operations.
3.3 analysis of cash flow (Cash Flow Analysis)
This method focuses on cash flows into and out of the business, help to assess the solvency and investment. Businesses can analyze:
- Cash flow from business operations.
- Cash flow from investments.
- Cash flow from operations funding.
3.4 comparative analysis of industry (Benchmarking)
Comparison of financial indicators of enterprises with industry average or competition helps to determine financial position and operational performance.
For example, If gross profit margin of the business is lower than the industry average, can businesses are experiencing problems with the cost of production or pricing strategy.
3.5 DuPont analysis
This method helps businesses analyze factors that impact ROE to understand the motivation boost profits. DuPont analysis ROE through three components:
- The profit margin net.
- Rotation total assets.
- Financial leverage.
4. Phân tích các yếu tố tài chính của doanh nghiệp
4.1 Phân tích báo cáo tài chính
Financial reporting is the source of important data to help businesses assess the financial health measurement, operational efficiency, forecast the development trend in the future. The analysis of financial statements, business support, financial control and the investors, banks and other stakeholders in evaluating the creditworthiness of the business.
Financial statements of the business usually consists of three main reports: balance Sheet reports the results of business activities report cash flows. Each report offers a different perspective on the financial situation of the business.
4.1.1 Bảng cân đối kế toán (Balance Sheet)
The balance sheet can show the financial condition of the business at a certain time, providing information about assets, liabilities, and equity.
The balance sheet is divided into two main sections:
- Property (Assets): includes short-term assets (cash, inventory, receivables) and long-term assets (factories, machinery, real estate).
- Liabilities (Liabilities): Includes short-term debt (bank loans, short-term accounts payable), long-term debt (bonds, long-term loans).
- Equity (Equity): Total net assets of the enterprise after deducting the debts.
The basic formula of the balance sheet accounting: {property} = {Liabilities} +{Equity}
Meaning of balance sheet
- Assess the likelihood of payment and the level of financial security of the business.
- Determine the level of use of borrowed funds, the ability to balance financial.
- To help investors, banks assess the level of risk when investing or financing.
For example, If the ratio of debt to pay on the total assets (Debt Ratio) is too high, the business may be experiencing financial risks due to excessive reliance on debt.
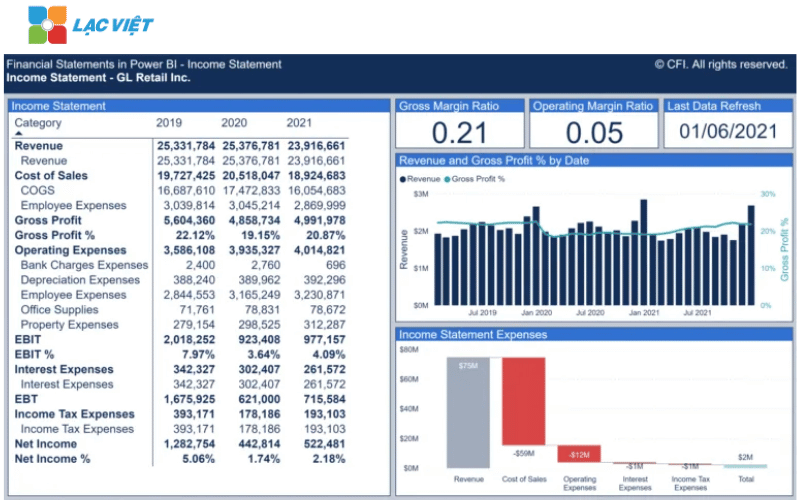
4.1.2 Báo cáo kết quả hoạt động kinh doanh (Income Statement)
Report results of business activities thể hiện kết quả tài chính của doanh nghiệp trong một kỳ kế toán, thường là theo tháng, quý hoặc năm. Báo cáo này cung cấp thông tin về doanh thu, chi phí và lợi nhuận.
This report includes important part:
- Net revenue (Net Revenue): revenue after subtracting deductions such as discount sales return.
- Cost of goods sold (COGS – Cost of Goods Sold): Costs directly related to the production or purchase of goods.
- Gross profit (Gross Profit): net Sales – cost of goods sold.
- Operating expenses (Operating Expenses): includes cost of sales, cost management business.
- Operating profit (Operating Profit/EBIT): profit before interest and tax.
- Financial costs (Financial Expenses): Interest on bank loans, the financial expenditure other.
- Profit before tax (EBT – Earnings Before Tax): profit after deduction of financial costs but not tax deductible.
- Net profit (Net Profit): the actual amount business earns after deducting the corporate income tax.
The meaning of report business results
- Determine the profitability of the business through each of the states finances.
- Evaluate the effectiveness of business activities by comparing the profit margin through the year.
- Provide important data to help businesses adjust business strategy and cost optimization.
For example: If the net profit (Net Profit Margin) decreased gradually over years, can businesses are having problems operating costs or market competition.
4.1.3 Báo cáo lưu chuyển tiền tệ (Cash Flow Statement)
Statements of cash flows cho biết dòng tiền vào và dòng tiền ra của doanh nghiệp trong một kỳ kế toán, giúp doanh nghiệp hiểu rõ khả năng tạo ra tiền mặt để duy trì hoạt động kinh doanh, đầu tư.
This report is divided into three main channels:
Cash flow from operating activities (Operating Cash Flow – OCF)
- Reflect the amount of money earned or spent from the main business activities.
- If cash flow activities, ocean, businesses have the ability to generate enough cash to maintain operations.
Cash flow from investing activities (Investing Cash Flow – ICF): Including the cash account used to purchase assets, investing in new projects, or sale of assets.
Cash flow from operations funding (Financing Cash Flow – FCF): include transactions related to raise capital, pay dividends, or repayment of the loan.
The meaning of the statements of cash flows
- Determine the solvency and maintain business operations.
- Assessment of the level depends on the loan or outside investment.
- Help business financial planning to maintain steady cash flow.
For example, If operating cash flows continuous, the business may experience liquidity problems and need review strategic cash flow management.
4.2 Phân tích nhóm chỉ số tài chính quan trọng
Group financial indicators are divided into five main groups: liquidity indicators, indicator of financial leverage indicators, operational performance, profitability index and cash flow indicator. Each group indicator provide a different perspective, helping businesses can comprehensive assessment of the financial ability of his.
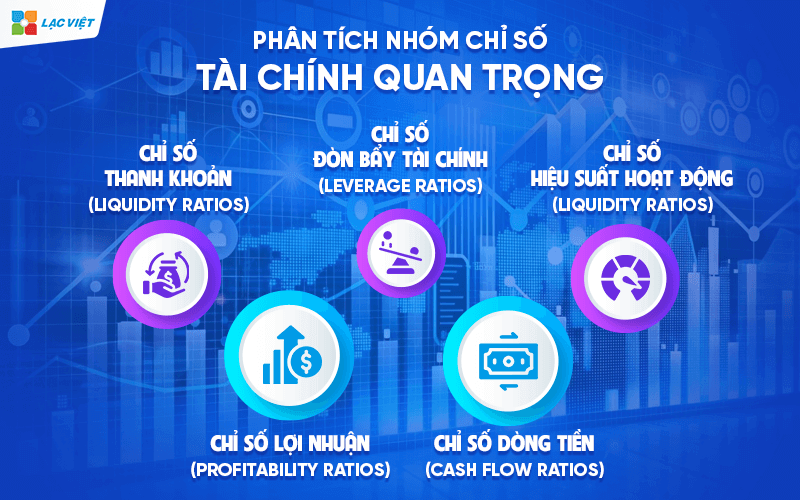
- Indicators of liquidity (Liquidity Ratios): liquidity indicators help businesses assess ability to pay short-term debts by moving assets out there. A business, have high liquidity will have the ability to meet financial obligations to term without difficulty.
- Indicator of financial leverage (Leverage Ratios): Group this indicator helps to assess the level of business use borrowed funds than equity and the ability to business meet debt obligations. Higher financial leverage can help businesses expand operations quickly, but also comes with risks greater financial.
- Index performance (Efficiency Ratios): Group this indicator measures the ability to use business assets to generate revenue, reflecting effective management of assets, inventory and receivables.
- Profitability index (Profitability Ratios): Group profitability ratios measure the ability businesses generate profit from the revenue and assets. This is one of the most important indicators help assess business performance, the level of profitability of the business.
- Money flow index (Cash Flow Ratios): Group money flow index to help businesses assess the ability to generate cash flow from business operations, investment and financing. Steady cash flow are important factors help businesses maintain operations, expanded investment and ensure liquidity.
Xem chi tiết tại bài viết “Analysis of financial indicators business: recipe and meanings 15 financial indicators“
4.3. Phân tích xu hướng và dự báo tài chính doanh nghiệp
Analyze financial trends is the process of reviewing the financial indicators through many different stages to identify the trend of growth or decline. This is a useful tool to help businesses assess performance and adjust business strategies to improve financial results in the future.
4.3.1 Cách nhận diện xu hướng tài chính từ dữ liệu lịch sử
Analyze financial trends based on the comparison of financial data through the accounting period different to find out model of development. Some popular methods to identify financial trends, including:
- Analysis cycle (Time Series Analysis): review financial volatility by month, quarter, or year to detect long-term trends.
- Compare financial data between the states accounting: reviews the changes in indicators such as revenue, profit, expenses, cash flow.
- Growth rate compound annual (CAGR – Compound Annual Growth Rate): speed Measurement average growth of revenues or profits for many years.
For example, If the net revenue of the business growth of 10% per year for 5 consecutive years, this shows a trend of sustainable growth. If, however, net profit margin decreased despite increased sales, the business might be experiencing problems on cost control.
The pattern trend analysis helps the business to forecast the change of financial indicators based on past data. Some popular models include:
- Model linear regression (Linear Regression): Forecast trends based on the relationship between the financial variables.
- Model ARIMA (AutoRegressive Integrated Moving Average): trend Forecast the revenue, profit and cash flow based on real-time data.
- Model volatility analysis (Variance Analysis): compare actual results with plans to assess the difference, find out the cause.
Thanks to these models, businesses can predict trends, financial, optimization, business strategy and cost control more efficient.
4.3.2 Phương pháp dự báo tài chính doanh nghiệp
Financial forecasting is the process of estimating the financial indicators in the future based on current data and forecast models. The accurate forecasts help business plan budget, assess business performance and make investment decisions accordingly.
Revenue forecast
Forecast sales is one of the important steps to help businesses identify growth potential and planning financial planning. Some popular methods to forecast revenue include:
- Forecast according to the trend history: Using data revenue the previous year to determine the growth pattern.
- Forecast by market share (Market Share Analysis): Based on the change of the market and the business to estimate the revenue in the future.
- Forecast factors, macroeconomic: consider the impact of interest rates, exchange rates and inflation to revenue.
Cost forecast
Forecast costs to help business budget control, optimize business operations. Some common methods include:
- Forecast costs according to the model the proportion of revenue: operating Costs, marketing costs and the cost of raw materials tend to fluctuations in revenue.
- Forecast costs, according to data history: Based on the cost data of the previous period to plan a budget.
- Forecast costs according to the analysis of fluctuations: comparison of planned, actual to forecast the optimal cost.
Cash flow forecast
Cash flow forecast helps businesses ensure sufficient financial resources to sustain operations, avoid the shortage of liquidity and optimize strategic capital funding. A number of methods, cash flow projections, including:
- Forecast cash flow-direct: Determine the cash flows into and out from the business activity, investment and finance.
- Forecast cash flows indirect: Based on financial statements, financial indicators to predict cash flow.
- Cash flow forecast according to the scenario (Scenario Analysis): construction of the financial scenario different to assess the impact of risk factors.
Forecast profit and performance
Forecast profit to help businesses calculate the expected return in the future and evaluating performance. Some common methods include:
- Forecast gross profit margin and net profit: trend analysis of the profitability index to forecast profitability.
- Forecast rates of return on equity (ROE) and total assets (ROA): to Help businesses evaluate the performance of use of funds.
- Analysis of the risk scenarios: scenario builder to forecast the impact of external factors to profitability.
5. Công cụ phân tích tài chính doanh nghiệp hiệu quả – trực quan
In the context of modern economic, financial analysis crafts is no longer enough to meet the needs quick decisions and accurate. Therefore, businesses are gradually moving to use technology, Business Intelligence (BI) in combination with artificial intelligence (AI) to optimize the process of financial analysis.
BI helps business automate financial reporting, visualization complex data and provide the model, financial forecast based on real data. Here are three BI tools top in financial analysis, to help businesses increase accuracy, reduce errors, and optimize financial performance.
5.1. Power BI – Công cụ BỊ hỗ trợ AI trong phân tích tài chính
Power BI platform is the data analysis of Microsoft, to help businesses integrate, analyze, visualize financial data from various sources. With the ability to connect flexible Power BI support business, create financial reports, according to monitor data in real-time and application of AI to identify financial trends.
Salient features of Power BI in financial analysis
- Visualization of financial data with charts and dashboard (dashboard).
- Direct connection with the accounting system, ERP, SQL Server, Excel to collect and sync data.
- Supports AI to analyze financial trends, forecast, revenue, profit and cash flow.
- Automatic update of financial reports in real time, minimize errors when processing data.
- Create data models and KPI analysis financial flexibility.
The Power BI app in financial analysis business
- Track financial performance: Business can build reports to track revenue, profit, cost in real time.
- Cash flow forecast and profit: AI in Power BI can predict financial trends based on historical data.
- Analysis of investment efficiency: business Support performance evaluation of investments and the proposed optimal strategy.
For example: A business use Power BI to track sales by each branch, can automatically detect the areas with low profitability and propose strategies for improvement.
5.2. Tableau – Công cụ phân tích tài chính và dự báo xu hướng
Tableau is a BI tool that specialize in analyzing financial data intensive. With the ability to handle complex data, Tableau helps business data mining, financial intuitive, easy to understand and can build the prediction model accuracy.
Salient features of Tableau in financial analysis
- Processing and visualization of financial data intensive.
- Integrated AI to analyze trends, finance, risk warning and optimize cash flow.
- Support analysis of financial data in multiple dimensions, to help businesses easily compare data between the states of finance.
- The ability to build models, financial forecasting based on historical data.
- Interface drag-and-drop helps users easily create dashboard and reports automatically.
Application Tableau in financial analysis business
- Analysis of financial performance according to each branch or department business.
- Forecast financial trends based on the models WHO help business budget planning and financial strategy.
- Compare the financial performance between the product, service, or different market.
For example, A business can use Tableau to compare the rate of profit between the year, determine the cause of change and propose strategic cost optimization.
5.3. Lạc Việt Financial AI Agent – Giải pháp AI hỗ trợ phân tích tài chính theo thời gian thực
Lac Viet Financial AI Agent is the system analysis report financial indicators integrated artificial intelligence (AI) first in Vietnam. This tool helps business automate financial reporting, support, trend analysis, forecasting, risk and financial advisory smart.
Feature highlights of Vietnam Financial AI Agent
a) analyze financial data in real time
- BI Financial Dashboard integrated AI helps businesses track the financial health and business performance in real time.
- Direct connection with the accounting system and ERP software, ensuring your data is always accurate.
b) Forecast financial trends by AI
- AI automatically analyzes historical data to forecast trends in the financial as revenue, cost, profit.
- Warning of financial risks before they occur, help with business plans, timely adjustment.
For example, If AI to detect operating costs increased by 10% in 3 continuous months, the system will alert and propose solutions to cut costs.
c) decision Support smart financial
- AI financial advisor contextual help businesses make decisions more accurate.
- Automatic system financial reporting standards IFRS and VAS, in accordance with accounting standards the international.
App Vietnam Financial AI Agent in financial analysis business
- Automation, financial reporting, reduce errors manually.
- Analysis of the financial health in real-time to evaluate business performance.
- Forecast financial trends and support decision quickly.
Financial analysis business not only help to assess the performance but also plays an important role in building strategic long-term financing. Through the analysis of financial ratiostrends cash flow forecast models, businesses can make decisions more accurate, risk control, and optimization of trading strategies.


![[ĐẦY ĐỦ] Mẫu báo cáo tài chính, tình hình tài chính file excel theo Thông tư 200 và 133](https://lacviet.vn/wp-content/uploads/2025/04/mau-bao-cao-tai-chinh.png)