![[Mẫu chuẩn] Báo cáo doanh thu doanh số bán hàng bằng Excel theo ngày, tháng](https://lacviet.vn/wp-content/uploads/2025/02/mau-bao-cao-doanh-thu.png)

Sample income statement is an important part in the system financial statements your business helps to monitor, analyze, total revenue, sales, income sources, in a given time period. The report sales accurately supports not only assess business performance, but also help enterprises to optimize sales strategy, financial decisions effectively.
The same Lac Viet Computing find out details about this report type, the way of revenue reports with excel and analysis to put out is planned business operations in the new period.
1. Reported revenue is what?
Revenue report business number is financial document reflects the total revenues and revenues from business activities of the enterprise during an accounting period (day, week, month, quarter, or year). This report helps to track the effectiveness of business activities, identify trends, sales support, financial planning correctly.
The role of reporting, sales/revenue in financial management, business
Control performance assessment business
- Businesses can compare revenue in each stage to determine the trend of growth or decline.
- Easily identifiable product, service, or sales funnel that works the most effective.
- Adjustable support business strategy, if it detects revenue decreased or did not reach the goal.
For example, A company that provides software, SaaS can use sales reports to analyze the level of growth of revenue new registration than revenue renew, from which the optimization strategy to take care of existing customers to increase the rate of renewal of the contract.
Support financial decisions – strategic planning
- Revenue report offers important data to help business financial forecasting, budgeting, tuning business plan.
- Help determine the desired profit margin and adjusted sales price match to ensure financial efficiency.
- Support the decision as to expand business scale, investment in new products or optimize the cost of operation.
For example: A manufacturing enterprise can compare the actual sales with revenue forecast, from there decide whether to expand the plant or hire additional workers or not.
Track sales effectiveness and employee performance
- Help business reviews, sales by individual salesperson, each department or each shop.
- Support the construction plan, bonuses, commissions, evaluate employee performance.
- Identify the factors that affect the sales as promotions, services, customer care or consumer trends.
For example, An insurance company can use the report, sales by staff to determine those employees whose performance highest sales to plan training for other employees.
2. The components in the sample report sales revenue in excel
A sales report criteria should include the important information to help the business monitor overall revenue analysis, sales performance in many different angles.
- Total revenue: This is the total amount that the business gained from sales activities or provide services in a certain period of time. Total revenue can be divided according to each product, service, branch or sales channel.
- Revenue by product/service: Lists the revenue from each product category or product group to product reviews, how best seller. Helps business focus on products with high profits, adjusted trading strategy accordingly.
- Revenue by region/channel sales: Determine business performance according to each market or branch to assess any area bring in revenue for the best. Analysis by sales channel (direct, online, dealer, wholesale, retail) to help optimize distribution strategy.
- Revenue by customer: Specify the group that contributed the most to the revenue to centralized care or strengthen the focus of marketing activities. Construction support program dear customers, or policies to reduce the price for potential customers.
- Discount, price reduction, reimbursement: This is the account except in revenue include trade discounts, promotions, discounts, goods, repayment. To help businesses assess the degree of influence of the promotions to general revenue.
- Net sales: Is the total revenue after deducting rebates, discounts, goods, repayment. This indicator helps business has the exact look of the actual amount earned from business activities.
3. Standard sample income statement sales in Excel by date, month
Depending on the objective, the business can use a variety of different reports to monitoring and evaluating business performance.
3.1 Sample report sales revenue in the period (day, week, month, quarter, year)
- Used to track trends in revenue over time to help businesses identify seasonal adjustment business plan.
- Compare revenue between the period to assess the level of growth.
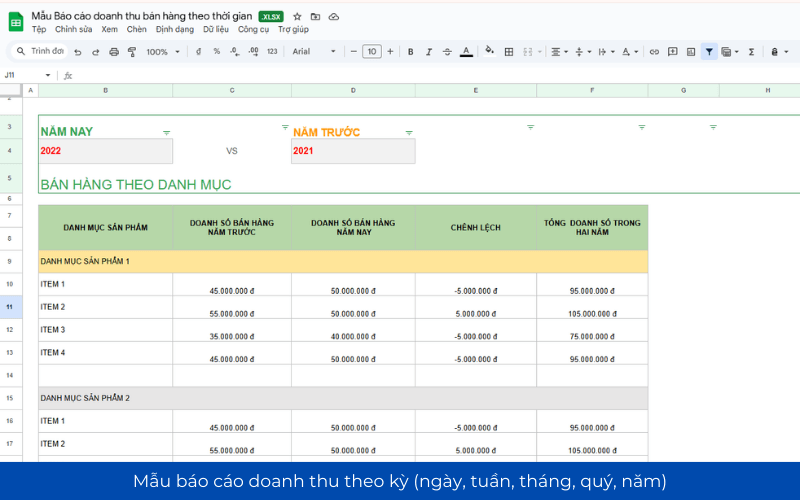
For example, A retail company can track monthly sales to determine the moment the highest sales, from which optimization marketing campaign seasonal.
3.2 report Template sales sales by product/service
- Helps business identify products or services that are bringing the highest profit.
- Supports business optimization, product portfolio, focusing on the best-selling products.
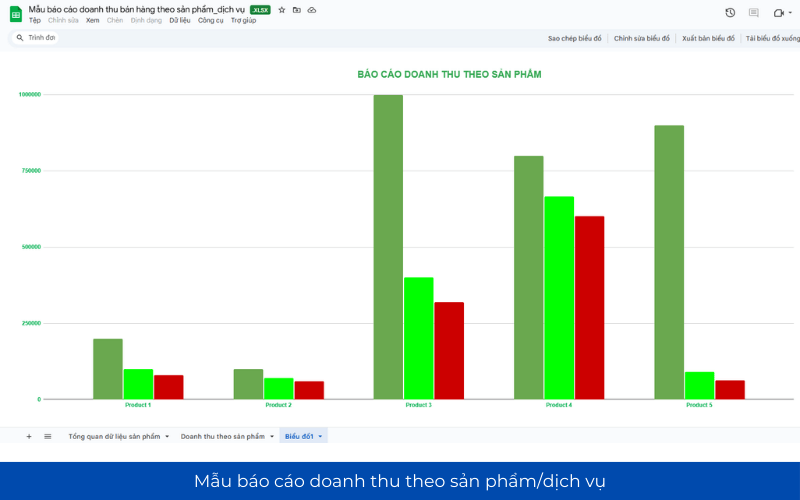
For example: A business food business can track sales by each group of products, such as drinks, fast food, packaged food to take out sales strategy accordingly.
3.3 Sample report revenue by region or branch
- Support business reviews business performance according to each market or business locations.
- Help decide whether to expand operations in any area, based on current revenue.
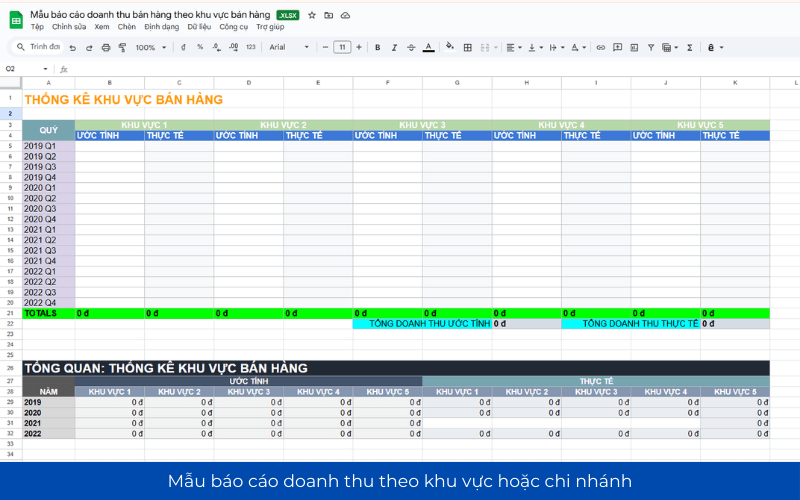
For example, A chain of fashion stores can use the report revenues by region to identify the branch which works best to optimize the inventory for each location.
3.4 report Template sales revenue by customer
- Define customer groups contributed the most to the revenue to focus marketing strategy – customer care better.
- Help construction business promotions, discounts, or preferential policies dedicated to our beloved customers.
For example: A software company can use the report of revenue by customer to identify business customers are spending the most, focus on building personalized services for this group of customers.
4. Instructions on how to do income statement sales the implementation steps in detail
Report sales play an important role in monitoring the situation, business performance reviews, sales support, financial decisions correct. To ensure reports are transparency, full help for business, need sample construction report revenue in a scientific way, easy to understand have the ability to in-depth analysis.
Step 1: Determine the goal of the report, sales
Before reporting enterprise should define specific goals to ensure appropriate report with management needs, such as:
- Track total sales by day, week, month, year.
- Reviews sales performance by product, distribution channel, customer.
- Compare revenue between the states to analyze trends.
- Take strategic decisions about pricing, promotion and investment.
Step 2: collect revenue data accurate
Revenue data need to be accurate, timely updates and synchronization between the parts to ensure reports no errors.
Use accounting software, sales management
- The accounting system can automatically recognize revenue from the sales funnel, invoicing inputs, banking transactions.
- Management software sales (POS) help recorded in detail each transaction, product, sales and revenue by each point of sale.
Sync data from the ERP system, POS or CRM
- To the ERP system help data integration of sales with inventory management, financial accounting.
- CRM helps track sales by each customer, evaluate the effectiveness of sales according to each customer segment.
Check out the collated data with the other financial statements
- Revenue comparison in the report with bill of sale, banking transactions, profit and loss statement to ensure accuracy.
- Check discount rate refund to assess the degree of influence on the actual revenue.
Step 3: data Classification revenue
After collecting data need to be classified in revenue according to the criteria important:
Revenue over time
- Daily revenue.
- Revenue by week/month/quarter/year.
- The growth trend in revenue over the states.
Revenue by product/service
- Sales of each product/service.
- Best selling products and products with low sales.
Revenue by sales channel
- Sell directly in the store.
- Sell via our website, e-commerce (Shopee, Lazada, Amazon).
- Sold through agents and distributors.
Revenue by customer
- New customers than old customers.
- Revenue from VIP customers.
- The average value orders of each customer group.
Step 4: synthesis & data processing
After sorting the data, conduct data aggregation by the support tools such as:
- Excel/Google Sheets: Use the formula calculations (SUM, AVERAGE, PIVOT TABLE) to synthetic data.
- Accounting software: data Export report automatically.
- Power BI, Tableau: Create visual reports with charts, tables of data.
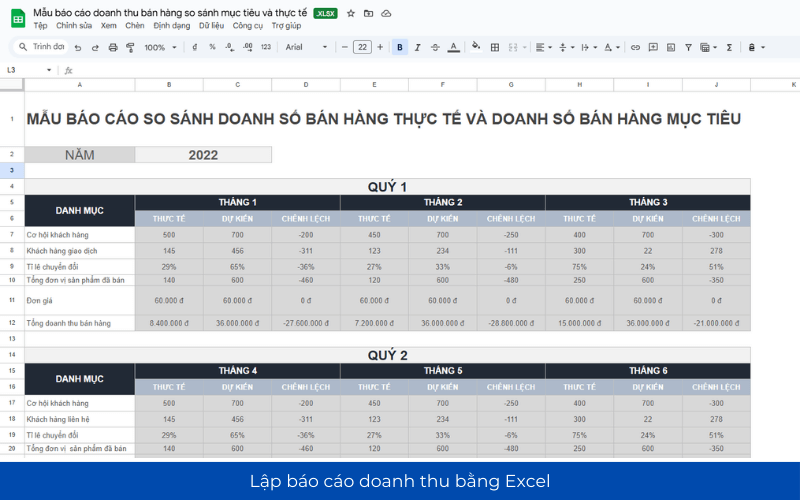
Reporting revenues sales by Excel
Excel tool is simple but powerful business reporting revenue in a flexible way.
Step 1: Create the data table revenue
The main columns: transaction Date, product code, quantity, unit price, total revenue, discount, net revenue.
Step 2: Use Excel formulas to sum data
- SUMIF() to calculate the total sales by individual products.
- SUMIFS() to calculate the total sales by each time, area, or sales channel.
Step 3: Draw the graph visually
- Use column chart or line chart to show trends in revenue over time.
- Charts help analyze the proportion of revenue by product or region.
Use accounting software to set up automatic reports
- Accounting software can automatically extract data revenue by term, product, or customer.
- Support export the report as Excel or PDF to send to the leader board.
For example, A commercial company can set up accounting software to automatically send revenue report weekly by email to the board of directors.
Step 5: presentation of report revenue
After pooling of data, need to present a report that is easy to understand and make a decision. Structure of a report revenue typically includes:
General information about the report
- Report name: Reported Revenue Months 11/2024
- Person reporting: [Name of establishment]
- Reporting date: [Day/month/year]
- Reporting period: [Day/Month/Quarter/Year]
Total revenue
| Indicators | Revenue (VND) | Compare the previous period (%) | Compare the same period of the previous year (%) |
|---|---|---|---|
| Total revenue | [Amount] | [+/- %] | [+/- %] |
| Net sales | [Amount] | [+/- %] | [+/- %] |
| Gross profit | [Amount] | [+/- %] | [+/- %] |
Revenue, according to analyst group
- Revenue by product/service
- Revenue by sales channel
- Revenue by region/store
- Revenue by customer
Note: The report should have a table of data and graphs to easily track trends.
Step 6: analysis of
After presenting the report, should include analysis and identification to help business understand the business situation:
- Causes of increase/decrease revenue: market, seasonality, price, advertising campaign...
- The products/services are sharp change in sales.
- The effectiveness of each sales channel: what Channel are the trend growth, which channels need to optimize.
For example, If revenue from e-commerce increased by 20%, but sales from traditional store discount 10%, the business can consider to boost investment in e-COMMERCE.
Step 7: proposed solution
Based on analysis of revenue, and propose measures to improve or maintain business efficiency:
- Promote hot selling products to the optimal revenue.
- Consider discount or discontinue providing the product sales slow.
- Adjustment strategies price to match the market situation.
- Improve customer service to retain customer loyalty.
5. Analyzing report sales revenue in order to optimize business strategy
The analysis reported revenue properly helps business understand the factors which impact on business results, from which to make decisions appropriate to sustainable growth.
Below is the method analysis report to help businesses leverage financial data most effectively.
5.1. Trend analysis of revenue by duration
Analysis of sales over time to help businesses identify trends, growth, revenue forecast future, optimize sales strategies.
Compare sales by day, week, month, quarter, year
- Compare revenue between the different accounting to determine when revenue the highest and lowest.
- Helps business identify the pattern of growth, the business cycle over time.
For example, A retail business may have noticed the highest revenue at the end of the month due to consumers tend to spend after receiving a wage.
Analysis of the impact of external factors to revenue
- Determine the influence of seasonality, holidays, promotions, market trends or changes in economic policy.
- Help business plan strengthen advertising, complementary goods, or adjusting the selling price accordingly.
For example, A chain of fashion stores can see that revenue soared on the occasion of the lunar new Year, from which the planned import of early deployment of promotions before the high season.
5.2. Evaluate the performance of each product/service
Analysis of revenue by products help businesses identify items which bring the highest profit, and products you need to improve or remove.
Identify products/services, best selling less popular
- Compare the sales of each product to determine the staples contributed most to the total revenue.
- Remove or improve the product has low turnover by adjusting the marketing strategies or optimal selling price.
For example, A software company may have noticed wrapping services business brings higher sales package individual from that push marketing to the business customer.
Reviews profit margin on each product
- Not products highest-grossing always bring the biggest profit.
- Businesses need to compare rates of gross profit on each product to determine which items would actually bring high profits.
For example, A restaurant may find that the best selling dishes have low profitability due to high material costs, while some of the less common have the profit margin the better.
5.3. Analysis of revenue by sales channel
Analysis of revenue by sales channel to help businesses understand which channels bring in the most revenue, from which focuses on investment and optimize sales strategies accordingly.
Compare revenue between the sales channel
- Analyze revenue between direct selling, selling online, floor, ecommerce, wholesale, retail, dealer, showroom.
- Reviews channel which have lower operating costs but bring the most revenue.
For example: A brand of cosmetics may have noticed sales channel online on TikTok Shop bring in revenue better than the traditional store, from which enhance the campaign digital marketing.
Determine the sales channel, the most effective
- Cost analysis to operate each channel to ensure revenue generated from the channels that offset the costs of marketing and operated.
- If the channel would have cost too high, but revenues are not commensurate, the business can restructure or transform the business model.
For example, A furniture company may have noticed that channels showroom costs but not effective by the channel, consulting, online match, online ordering from there change the sales strategy.
5.4. Analyze sales by customers to optimize marketing strategies
The analysis of revenue by customer group helps businesses increase conversion rates, build sales strategies, personalization and optimization program customer care.
Specify the customer group major contribution to revenue
- Analysis of revenue by customer segment (business, personal, VIP customers, potential customers, loyal customers).
- Build preferential policy special dedicated to customer groups have high value.
For example: A company e-commerce may have noticed that 10% of customers generate 60% of revenue, from which deployment program VIP customers to retain them.
Evaluate the percentage of customers who return to buy
- Ratio analysis of customer first, compared with customers return to purchase again.
- If the rate of new customers is high, but the revenue does not increase, can businesses are having problems retaining customers.
For example: A business food business can be noticed that customer first-time buyers spend less but tend to come back several times, thereby optimizing campaign remarketing.
6. App Vietnam Financial AI Agent in the analysis of income statement sales
In the digital era, businesses not only need to report sales revenue tradition, but also need a system that automatically analyzes the data, make forecasts proposed revenue optimization. Vietnam Financial AI Agent is an advanced solution to help businesses increase efficiency analysis reports revenue, detect trends to improve financial strategy.
- Automate the process of collecting aggregate revenue data: Lac Viet Financial AI Agent integration with accounting systems, ERP and management software sales, automatically collect aggregate revenue data in real time. Minimize errors in reporting by collating automatically between the source data, to help businesses be accurate view of revenue by each product, region, customer, sales channel.
- Trend analysis, sales: Tool AI of Lac Viet help businesses compare revenue between the different stages, from which the current growth trend, seasonal, peak and duration decline in revenue. Analysis of revenue between the online sales channel, direct, ecommerce, agents to determine which channel brings the best results.
- Detect the cause fluctuations in revenue and suggestions for improvements: Tool AI can automatically analyze revenue data to detect abnormal changes, such as revenue plunged suddenly in a region or a product is selling slower than usual. Proposed solutions to improve revenue as booster promotion, optimal selling price or change the marketing strategy.
- Forecast future revenues based on historical data: Financial AI Agent using machine learning algorithms to predict revenue in the next period, to help businesses prepare financial plans accordingly. Detect trends of growth or decline for enterprises to adjust business strategy, control cash flow, optimal resources.
- Support customer analytics to optimize revenue: Tool AI help us analyze sales according to each customer group, specify a group of VIP customers and come up with strategies to retain customers effectively. Automatically analyze consumer behavior, frequency of purchases, spending trends to help businesses personalize the customer experience, increase revenue.
The establishment sample report sales revenue in excel accurate analysis of data effectively by applying technology into the process of revenue management will help the business to capture opportunities, forecast financial trends, and timely decisions. Business know how to leverage data revenue in a smart way, that business will have the advantage in the optimization strategy, sales, financial control, efficiency and create growth hacking. Don't just look at the revenue figures – let's harness the power of data to take your business even further.


![[ĐẦY ĐỦ] Mẫu báo cáo tài chính, tình hình tài chính file excel theo Thông tư 200 và 133](https://lacviet.vn/wp-content/uploads/2025/04/mau-bao-cao-tai-chinh.png)