

In the digital age, data is not merely the figures dry that has become a strategic asset, determine the success or failure of a business. From the purchase behavior of customers, operational efficiency, for to market trends – all elements are to leave traces in the form of data. However, collecting data is just the beginning. Bigger challenge is: How to analyze data effectively, have a clear goal bring real value to your business operations?
Many organizations now owns large data volumes, but have difficulty in choosing the correct method of analysis, understand the analysis results, especially transformed them into specific actions. This article is Lac Viet Computing built to help businesses understand the essence of the method of data analysis, how to select fit with business objectives, as well as step by step instructions to apply to decisions faster, smarter, reduce risk.
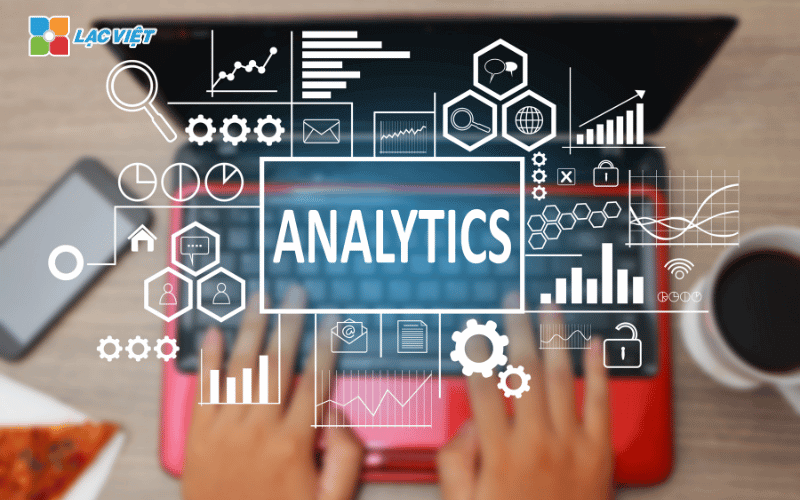
1. Analysis what is data? Why business need care?
1.1 the Concept of data analysis (Data Analytics) in a way easy to understand
Data analysis is the process handle, arrange, interpret data to draw useful information from it support business decisions more accurate. Learn a simple way, instead of just looking at raw numbers, business use of analytical methods to turn data into meaningful story.
For example, if a retail company has revenue data in each month, they can use data analysis to detect that the product is hot selling in summer, there is a products B tends to decrease in the fourth quarter. These conclusions will help business planning, inventory, marketing, sales more effective.
The important point is: data analysis does not necessarily have to be complicated. With modern tools, businesses can start from the basic method, easy to deploy but still bring value clear.
1.2 practical value that the business received from the data analysis
Data analysis is a business tool to help businesses increase efficiency, profitability. Below are the specific values that the business can get when applying the correct method of data analysis:
- Decision accurately and timely: Based on actual data, not feelings. Example: determine the time should promote marketing for a product line specific.
- Trend forecasting: identifying early the fluctuations in the market or changes in customer behavior to be adaptive strategy.
- Personalized customer experience: Data help understand the needs and interests of each customer group, from which optimize care programs, or to suggest suitable products.
- Optimal cost and resources: data analysis helps detect points not yet effective in chain operated or marketing activities to make timely adjustments.
According to a report by McKinsey, the business invested in data analysis can increase profits up to 20% compared to the business do not apply.
2. The method of data analysis common in business
Choosing the right method of data analysis will help the business to clearly see the picture at present, forecast the future, actively build strategies accordingly. Here are 5 methods of data analysis popular, is widely used in today's businesses – from startups to large corporations.
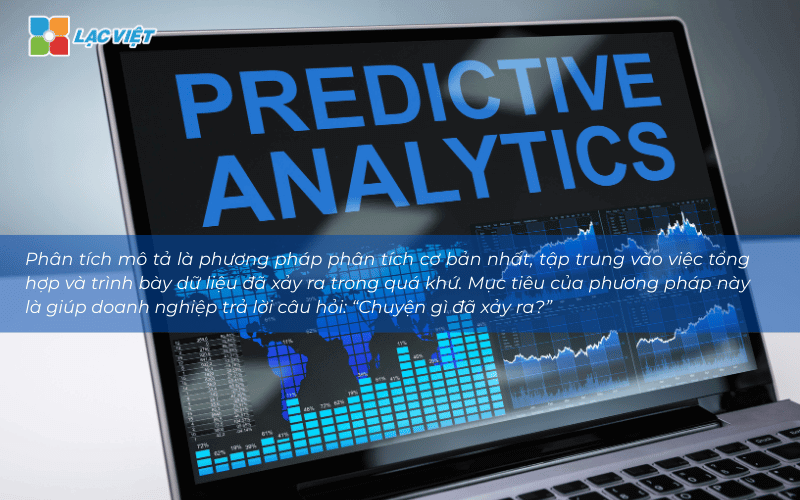
2.1 analysis description (Descriptive Analytics)
Analysis description is the method of fundamental analysis, focus on the synthesis, presented data that has happened in the past. The goal of this method is to help businesses answer the question: “what happened?”
Typically, businesses will use data from the available systems such as accounting software, CRM (customer management), POS (sales), or website to statistical indicators such as:
- Revenue by month
- The number of orders per week
- The rate of growth customers each quarter
- Inventory levels, on average, by product
Illustrative example: A chain of retail stores can apply descriptive analysis to compare revenue each branch in the first 6 months of the year. Results analysis showed that the branch A growth evenly, while branch B is plunged into two months. From there, the board of directors has the facility to continue to investigate the cause or reallocate resources appropriately.
Why businesses should start from the analysis described?
Because this method is simple but extremely useful to:
- Grasp the situation commissioning: Help leaders, functional parts understand the operation results in each stage, from master to detail.
- Support periodic reporting: Data is aggregated clear, visually through tables, charts, convenient for the work presented in meeting internal or report to investors.
- The foundation for the in-depth analysis over: When you know “what happened”, new businesses can take the next step: “why did that happen?” or “what should We do?”
Vantage point is the largest analysis description does not require the system complex technology. Just use Excel advanced, Google Sheets, or management software out there is that the business was able to build the report description value. This is the right choice to begin your journey to harness data in an efficient way.
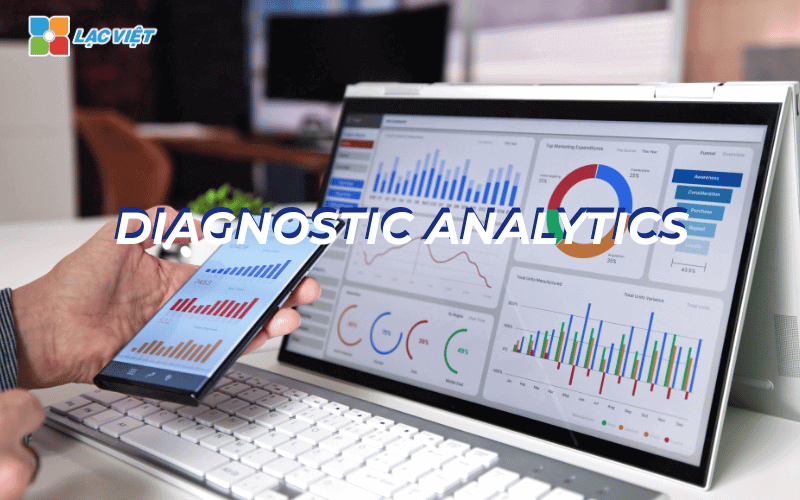
2.2 analysis of diagnostic (Diagnostic Analytics)
While descriptive analysis help you to know what happened, then diagnostic analysis continue to go deep to answer the question “why does that happen?”
Diagnostic analysis is the next step, important business does not stop at the observed phenomenon, which progress to find out the cause behind the change or problem is happening. Understanding the true cause will help businesses make the solution more accurate, instead of just adjusted according to the sense.
Illustrative example: A business ecommerce noticed sales month 3 strongly reduced, though remained the same advertising budget. Instead of a hurry to increase the budget or exchange product team analysis conducted for the site visits, conversion rate, time to stay home,... discovered that home was an error loading slowly make our customers get the page soon. Thanks to this, the business overcome the correct spot congestion, help sales recover quickly in the following month.
Actual value the business receives from diagnostic analysis:
- The right decision cause, no guesswork: Avoid the “trial and error” costly time and cost.
- Priority right issues to handle: In the business environment, resources are always limited. Diagnostic analysis helps business focus on the point of obstruction, have the greatest influence on the results.
- Improve effective long-term operation: When businesses understand the relationship between the indicators (for example, the rate of inventory affect revenue), they could adjust the process and policies in a systematic way.
Note when applying: analysis, diagnosis usually requires the enterprise system data is clearly organized, can reconcile between the different sources. However, now business can fully apply this method through the accessible tool such as Power BI, Google Looker Studio, or right on Excel, combined with the pattern filter and compare data.
2.3 forecast analysis (Predictive Analytics)
Analysis and forecast is a method that helps businesses look in the future based on past data and present. The goal of this method is to answer the question: “what can happen next if current trends continue?”
Other analysis description or diagnosis, which only focus on the “look-back” analysis, forecast enables enterprises active in the production plan, marketing, finance or hr, instead of reacting passively when the incident happened.
Illustrative example: A fashion companies can use sales data of the past 3 years to forecast demand shopping during the holiday season. Results analysis showed that the product typically spike in early march 11. Thanks to that, the business can prepare merchandise planning, advertising budget allocation right time.
How it works: forecast analysis often use statistical models or tools integrate artificial intelligence (AI), such as regression models, time series, or algorithm, machine learning (machine learning). However, thanks to the development of technology, nowadays, many software has a built-forecast models to help users don't need high expertise can still apply the effect.
Actual value the business receives:
- Active in the business plan: is Not automatically run according to the market, which can “catch” trend.
- Minimize risks: Avoid excess items, items missing, or investment at the wrong time.
- Optimal resource: accurate Forecasts helps to allocate the budget, manpower, materials and more suitable.
Note when deploying: forecast analysis does not require businesses to invest in high technology from the beginning. Complete business can start using tools like Excel advanced Power BI or SaaS platforms have integrated forecast features by model.
2.4 analysis driven action (Prescriptive Analytics)
If forecast analysis for know what can happen, then analyze the direction of action, answer the question: “what should We do to achieve the best results?”
This method of analysis, the highest level, can propose the optimum action to help businesses achieve business goals. Analysis of removal action often use data combined with mathematical models, simulation scripts, or artificial intelligence to evaluate the selection, suggesting the best solution.
Illustrative example: A business enterprise services can use data about customer behavior to determine which group has the ability to cancel the contract high. System analysis will suggest actions such as: sending emails care, call, consultation, or provide preferential retention.
Actual value the business receives:
- Decision-making faster and more accurate: Not confused between mass selection, which have clear direction based on the data.
- Optimal efficiency – reduce costs: analysis help businesses choose to have the lowest cost that still achieve the best results.
- Enhance competitiveness: When the opponents also are analyzing the data, your business has a specific action on the market.
Matching objects: analysis, action-oriented casual suit business had data platform stability, are operating in medium-scale to large, the desire to optimize operations in a comprehensive manner.
Hint deployment: Businesses can start applying each section, for example: use the hint function to campaign in the software marketing automation, CRM, or tapping feature “what-if analysis” in Excel, Power BI.
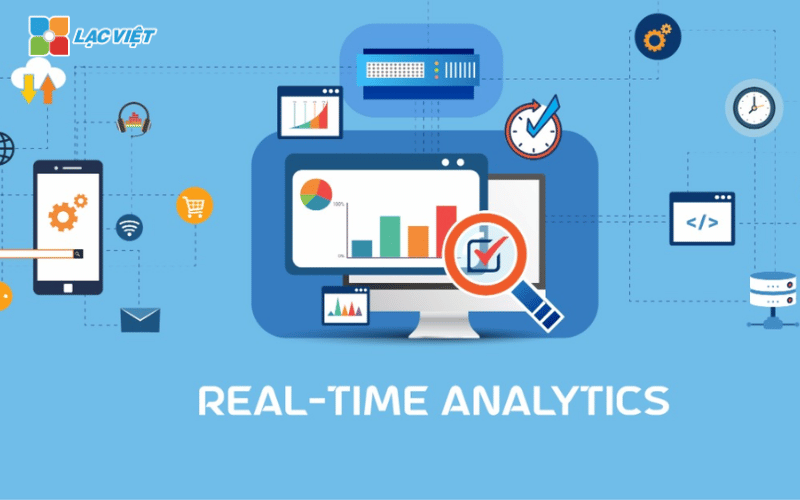
2.5 analysis in real time (Real-time Analytics)
In a business environment-paced constantly changing, the ability to make decisions even when the data arise is vital. Analysis in real time allows business data monitoring, give instant feedback, instead of having to wait aggregate the data by day, week, or month, as the traditional way.
Illustrative examples:
A floor commercial electronic detection of single-row spike within 30 minutes. Thanks to the system real-time analysis, businesses can immediately:
- Maneuver hr packing – delivery
- Increase the server's bandwidth, to avoid attenuating the website
- Activate ads additional promotions
How it works:
Analysis in real time use the technology to handle data streams (streaming), combined with the intuitive dashboard (dashboard), which allows users to capture important metrics as soon as they change.
Actual value the business receives:
- Detection and timely treatment breakdown: Helps minimize damage from system errors, operational risk or customer incidents.
- Increase user experience: For example, if a customer has a billing error, the system can be notified immediately to our team of CUSTOMER service timely intervention.
- A decision in short time: Particularly important in retail, ecommerce, logistics and banking.
Implementation requirements: although the need to system technology has the ability to handle continuous data, current platforms such as Google Looker Studio, Power BI (connect API), or the software BI has integrated streaming technology has helped businesses easily deploy step by step.
3. Choosing methods of data analysis in accordance with your business
In the process of understanding and application of data analysis, many businesses often encounter the question: “So, where to start, choose which method is appropriate?” The answer lies not in the running, according to the notion of a complex or expensive technology, but in understanding the actual needs of the business, evaluate the possibility of internal selection method to suit each stage of development.
3.1 Identify business goals
The first step and also the most important in the process of data analysis is to clearly define the business are want to answer questions. Here is a guideline to choose the method appropriate analysis.
Can your goal is to:
- To understand what happened in the past (descriptive analysis)
- Find the cause leads to a specific problem (diagnostic analysis)
- Forecast future trends (predictive analytics)
- Determine the optimum action to take (analysis of removal action)
- Instant reaction, with data going out (analysis in real time)
Illustrative example: If you are the sales director wants to know why sales last month fell, then the goals, the analysis should turn around cause (i.e., using the method of diagnostic analysis). If you are planning to import goods for the holiday season coming, you will need prediction method to avoid a shortage of goods, or inventory.
Identifying clear goals from the beginning will help the business avoid wasting resources into the analysis is not necessary, at the same time optimize time efficiency investments in data technology.
3.2 assess the capacity of current data
After you have a clear goal, enterprises need to look back on existing resources: whether we are ready to analyze the data?
There are three core elements should be considered:
- Data available: Business has collected enough data or not? Data can be centrally stored and easy to access no? There is scattered across multiple platforms (Excel, accounting software, CRM systems...)?
- Analysis tool: are You using any specific tool to process and analyze the data? There are leveraging the full potential from the available tools such as Excel advanced software, accounting software, management software sales?
- Manpower fit: your Team has to understand the data, have the ability to use analytical tools not? If not, maybe consider renting or using the software is simple, user-friendly.
Appreciating the ability of data to help businesses avoid investment rush into technology is not appropriate, and at the same time planning to upgrade according to the step by step logical, ensure sustainability and efficiency in the long term.
3.3 Choice of tools and software, data analysis, fit
Not business would also need to use the system complex data. In many cases, a suitable tool, easy to use, just reach will help you achieve fast performance a lot more than the big investment, but do not exploit the full functionality.
Here are a number of tools, data analysis, popular, is highly friendly and easy to deploy:
- Microsoft Power BI: Ease of integration with Excel, can visualize data using charts, dashboard (dashboard), suitable for the small and medium enterprises.
- Tableau: Strong data visualizations, in accordance with the business need to report vivid, support take out the in-depth analysis without programming.
- Google Looker Studio (formerly Data Studio): free, easy to use, suitable with business already familiar with the Google services such as Google Sheets, Analytics Ads.
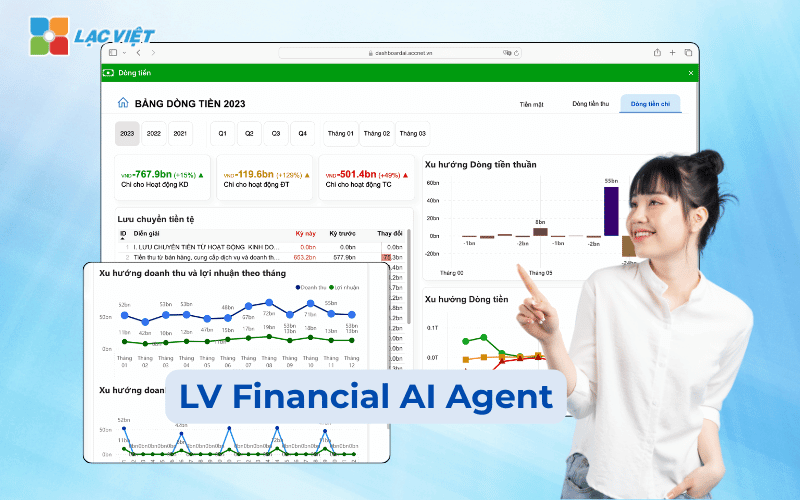
- LV Financial AI Agent: the solution, data analysis, financial apps, artificial intelligence, developed exclusively for Vietnamese enterprises. This tool not only helps to analyze financial statements, calculate the performance indicators such as ROA, ROE, debt ratio on the property, which also supports the business proposes to adjust financial, hints decisions according to target specific activities.
When choosing tools, businesses should consider the following factors:
- Cost and scalability: tools available for free? Can expand to scale the business increase?
- Level easy to use: Employees do not specialize in IT can be easy to use?
- The ability to connect data: instrument can connect with the business software that are used as ERP, CRM, accounting?
Technical support: Having documentation, support team when needed?
Choose the right tools to help businesses analyze data more efficiently, cost savings, easy, staff training, fast application to business operations daily.
The choice of method of data analysis appropriate will depend on business goals specific capacity data, current vision and long-term development of each organization.
Businesses do not need to start with the complex system. You absolutely can build a process-effectiveness analysis from the available platforms, combined with tools such as Power BI, Google Looker Studio or the specialized solutions such as LV Financial AI Agent – where artificial intelligence helps you to shorten the analysis time, more active in strategic financial decisions based on actual data.


![[ĐẦY ĐỦ] Mẫu báo cáo tài chính, tình hình tài chính file excel theo Thông tư 200 và 133](https://lacviet.vn/wp-content/uploads/2025/04/mau-bao-cao-tai-chinh.png)